A Sprint Board That Knows How Long Things Actually Took
A Sprint Board That Knows How Long Things Actually Took
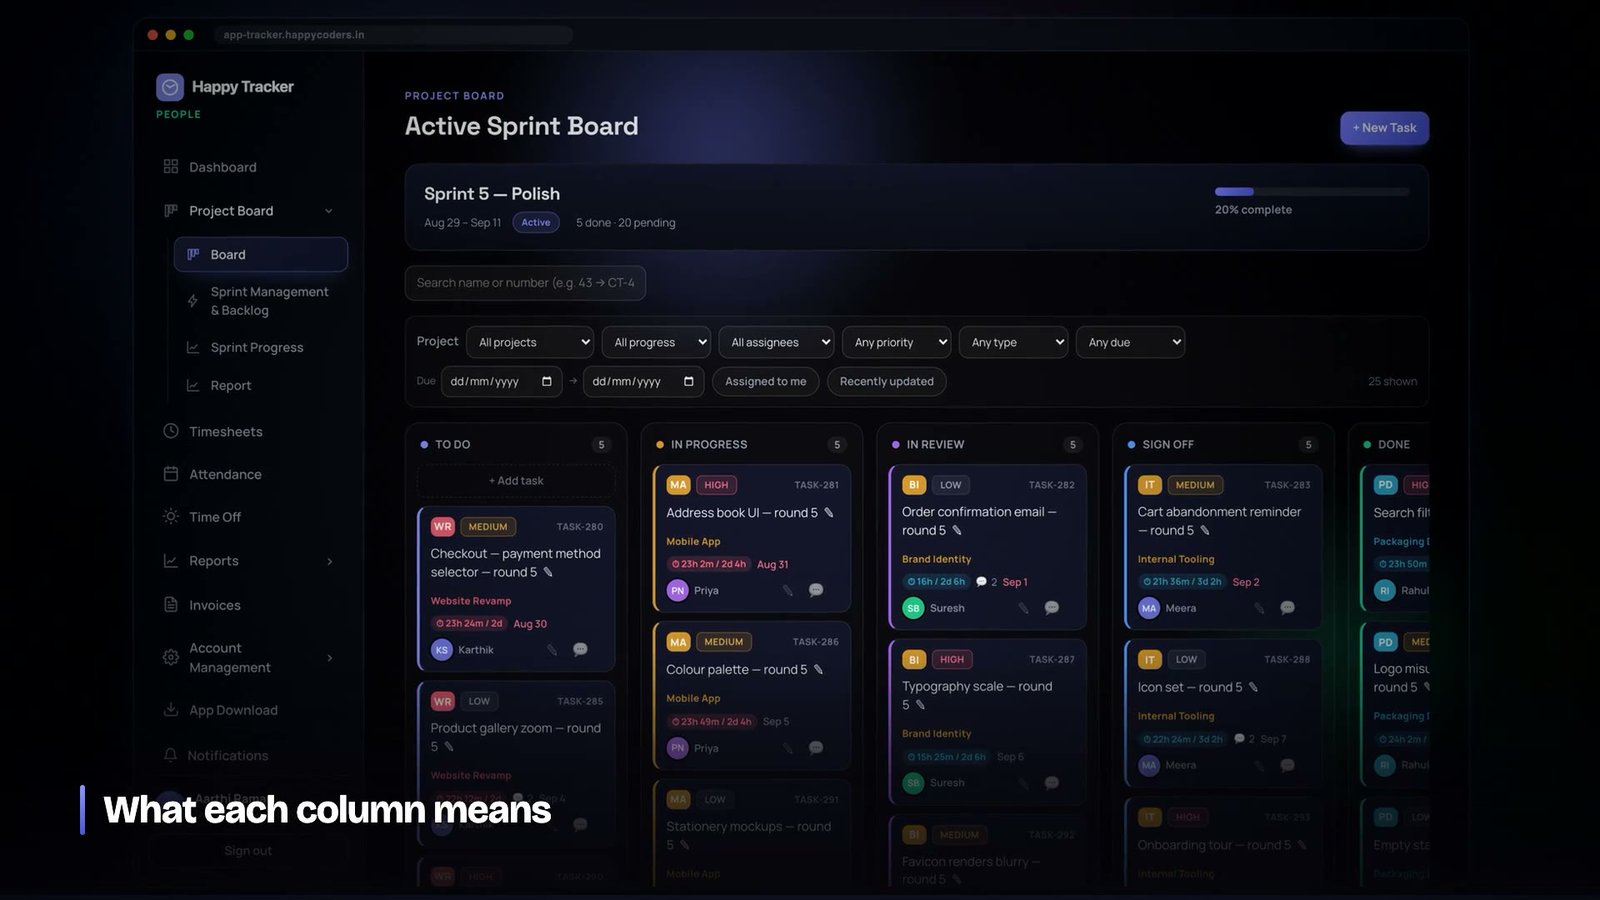
Almost every software team runs two systems that describe the same work and never speak to each other. There is a board, where work is broken down, estimated and moved between columns. And there is a timesheet, where hours are recorded. The board knows what was planned. The timesheet knows what was spent. Nobody ever puts the two numbers side by side, which is why teams can estimate badly for years without noticing.
This is not a tooling accident. It is what happens when planning and time tracking are bought separately, and it persists because joining them up manually is tedious enough that nobody does it twice.
What you lose by keeping them apart
The obvious loss is estimate accuracy. If nobody records what a task took, no estimate ever gets better, because there is no feedback. Teams estimate in points or days, deliver, move on, and repeat the same optimism next sprint.
The less obvious losses matter more.
- You cannot tell an underestimate from an interruption. A task that took three days against a one-day estimate might have been badly estimated, or it might have been touched for two hours a day while the person did something else. Those are different problems with different fixes and the board cannot distinguish them.
- You cannot see where a sprint’s hours actually went. Sprints slip because of work that was never on the board — support, meetings, a production incident. If hours are recorded somewhere else, that work is invisible and the sprint looks like a planning failure.
- You cannot bill from the board. A client asking what they were charged for wants tasks and hours together. Reconciling them by hand at month end is a job somebody has, and it is a job that should not exist.
If the plan and the hours live in different systems, the only thing you can ever measure is whether work finished. You can never measure what it cost.
One model: a task, a sprint, a project, and time that points at all three
The change we made is small to describe. A time entry can carry a task. That is all. Everything else follows.
Because an entry knows its task, and the task knows its project and its sprint, every hour recorded rolls up automatically. Hours per task, per sprint, per project, per person — none of which requires anybody to tag anything, because the tagging happened when they picked what they were working on.
The reverse direction is where it becomes interesting. A task can be asked what it cost, and the answer is not an estimate or a guess but the sum of the sessions attached to it, expandable into who and when.
Sprints belong to the organisation, not the project
One modelling decision surprised people and has been right in practice: a sprint belongs to the company, not to a project.
The instinct is to give each project its own sprints. It maps to how a project manager thinks. It also means a company running six projects has six independent cadences, and the question “what is everyone doing this fortnight” has no answer — which is the question a company actually asks.
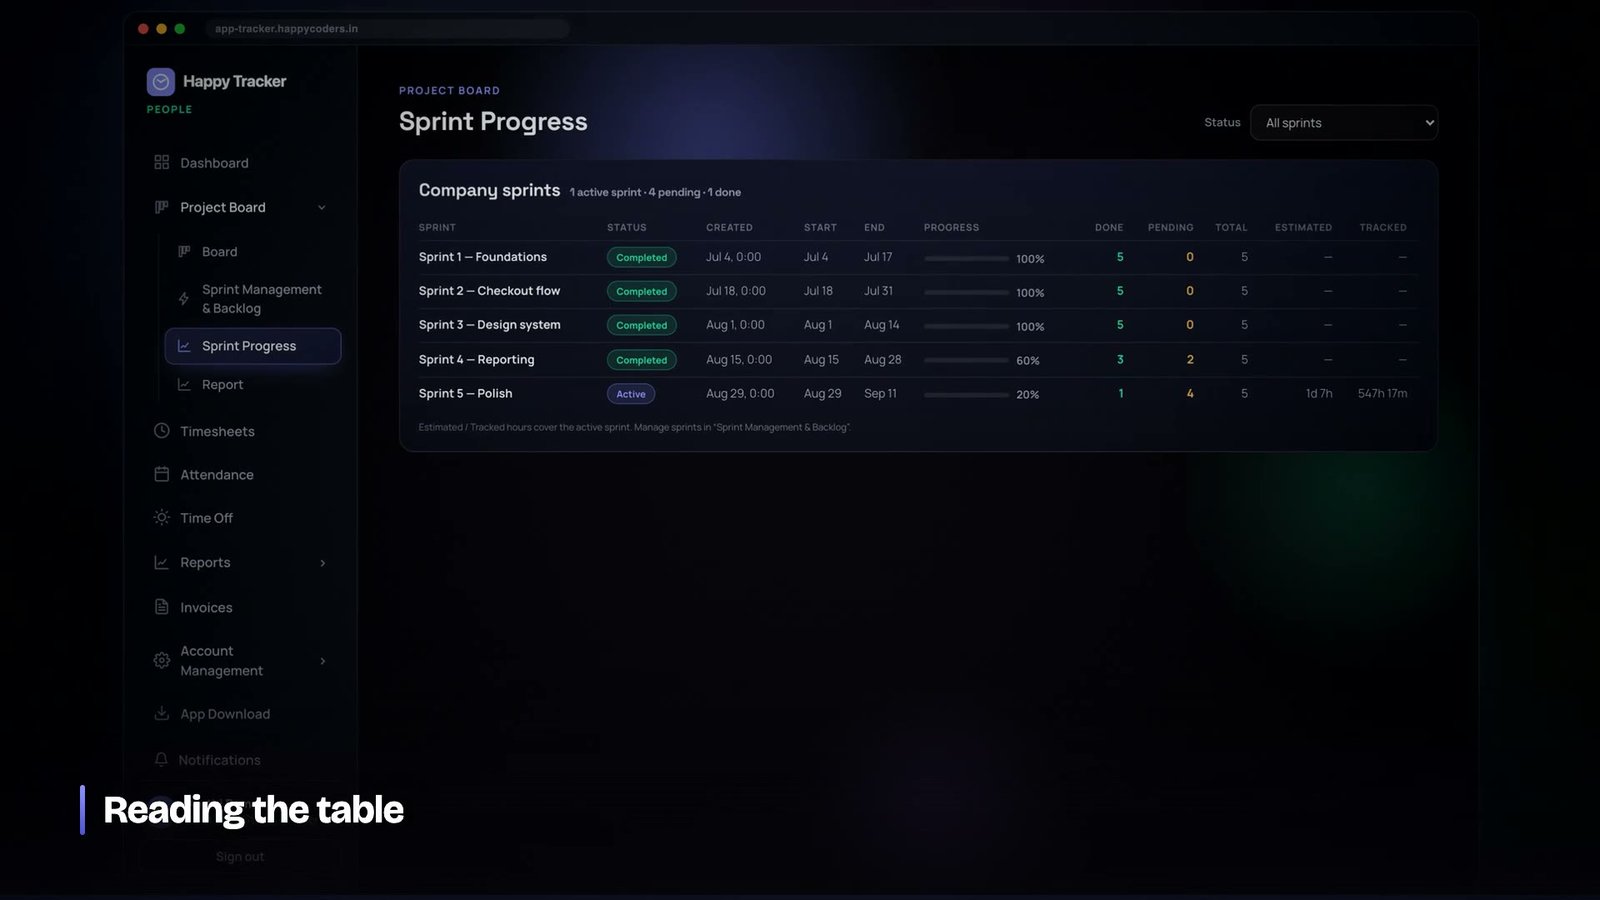
So there is one sprint cycle for the organisation, with exactly one sprint active at a time. Every task carries a project and a sprint independently, and the project selector on the board is a filter rather than a hierarchy. A single sprint contains work from several projects, which is what a two-week period in a real company contains.
Getting there from the previous model was the largest migration in the product: same-named sprints across projects merged into one, tasks re-pointed, per-project backlogs collapsed into a single organisation backlog, and one active sprint chosen where several had been active. Written to be resumable, because a schema change on MySQL that fails halfway cannot be rolled back.
Estimates in minutes, displayed in whatever people say
Estimates are stored as minutes. Not points, not days, not a string.
People type “2h” or “1d” or “90m” and all of it becomes minutes, because minutes are what tracked time is measured in and the comparison is the whole reason the field exists. An estimate in points cannot be compared to anything a timer produces, which is why teams that estimate in points never find out how long a point takes.
A day is eight hours, stated explicitly rather than assumed. Somebody will eventually ask whether a day means eight or twenty-four, and the answer should be written down where they can find it.
The number that changes behaviour
Once estimates and actuals are in the same units on the same record, one number becomes available that changes how teams plan: the ratio between them, over time, for this team.
Not for teams in general. Not from a book. For the people in this room, on this kind of work. If a team consistently delivers a one-day estimate in eleven hours, that is not a failing to be corrected, it is a coefficient to be used. The estimates are not wrong; they are consistently off by a knowable factor, and a team that knows its factor can quote accurately without ever getting better at estimating.
The teams that get the most out of this are the ones that stop treating the gap as a moral failing. A sprint where estimates came to sixty hours and tracked time came to eighty is not a lazy sprint. It is a sprint that contained twenty hours of something — support, review, meetings, a production issue — that was never estimated because it was never on the board. Making that visible is more useful than any amount of exhortation to estimate better.
Keeping the board usable while it carries more
A board that has become an accounting system is a board nobody uses. Everything above adds weight to a surface whose whole value is that it can be scanned in five seconds.
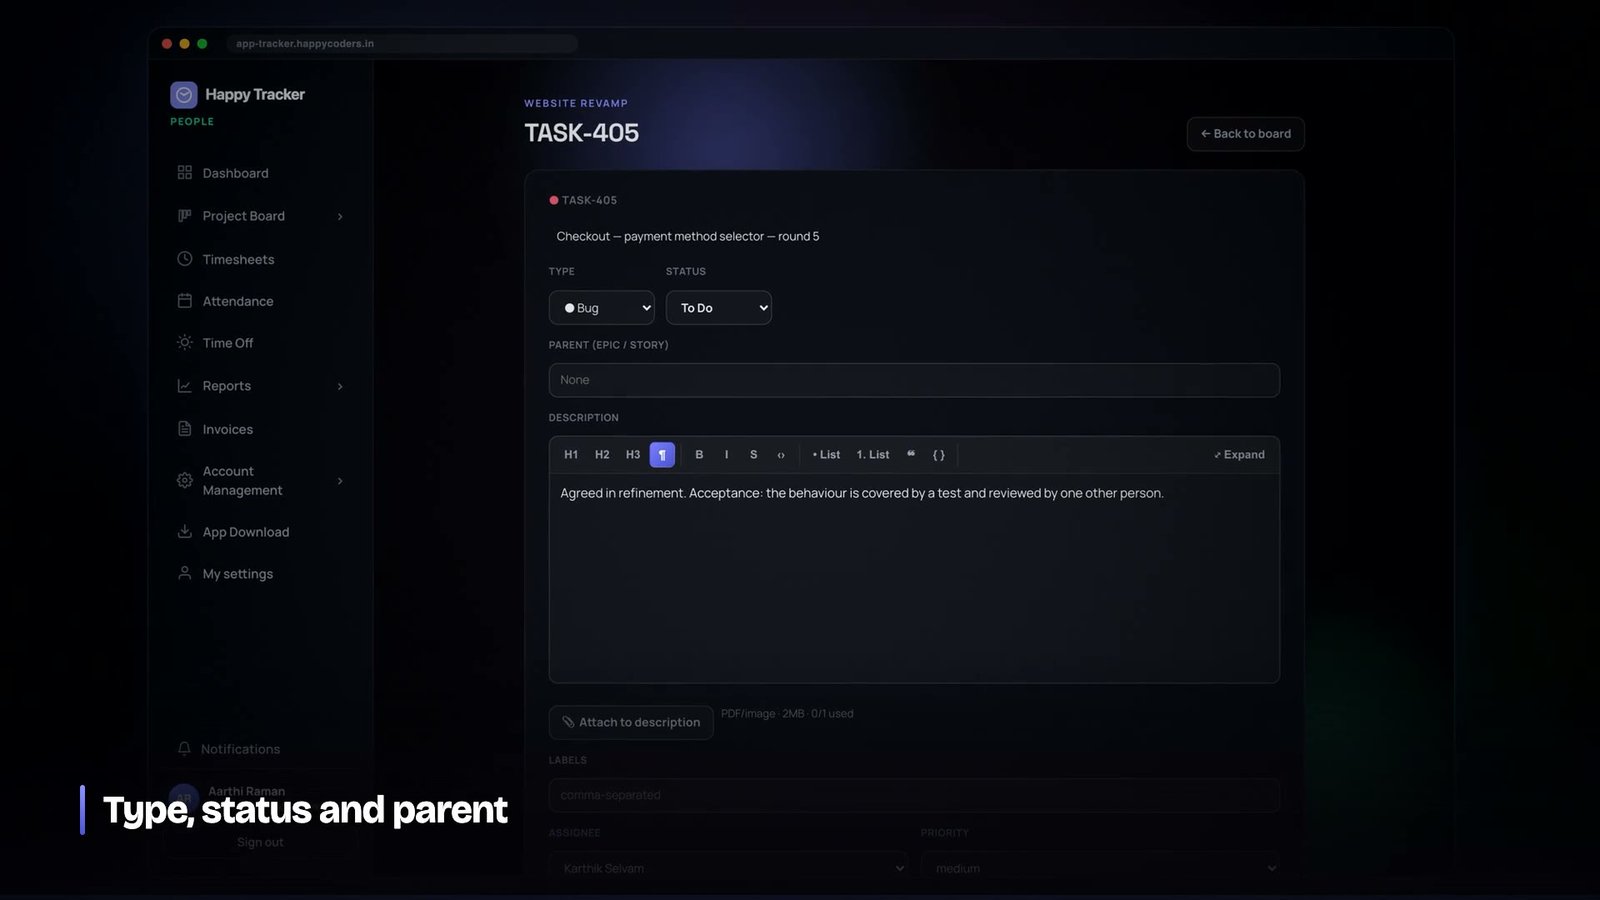
Three rules we hold to. The card shows what you need to triage — type, priority, estimate, assignee, due date, a comment count — and nothing else. Anything requiring thought lives in the detail view. And the number of controls on the board itself stays small enough that the columns are still the dominant thing on screen.
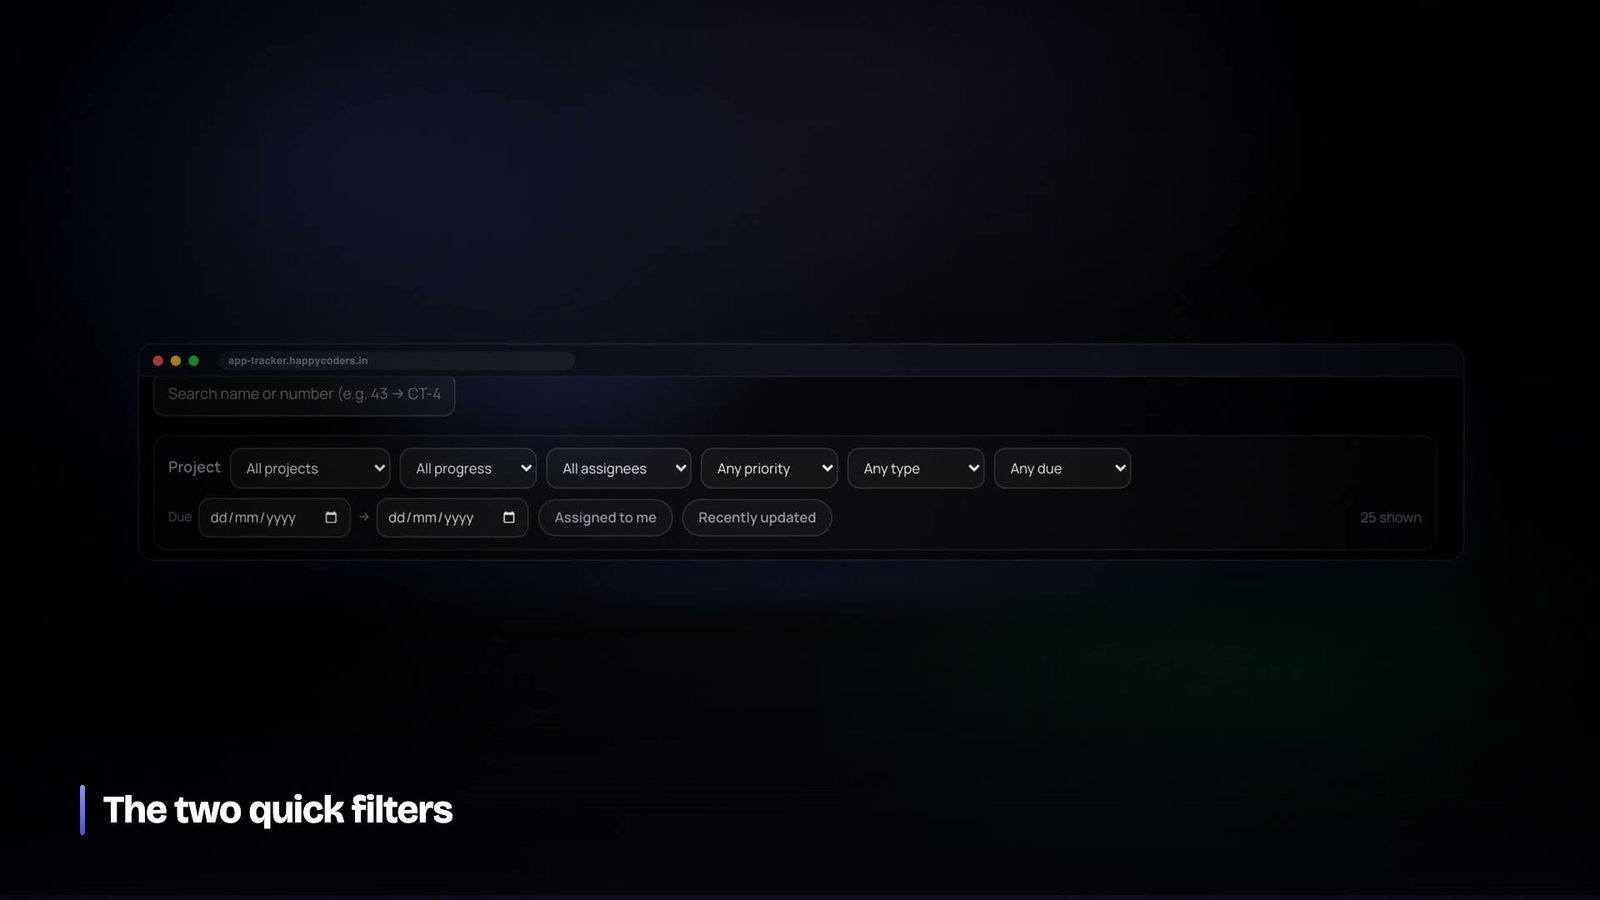
Filters are the exception worth spending space on, because a board with a hundred and forty tasks is unusable without them and a board with twelve does not need them at all. Ours narrow by project, assignee, priority, type, label and due date, and the count of what is showing is always visible — a small thing that stops people believing they are looking at everything when they are looking at a filtered view.
Where this actually pays off
Three moments, all of which used to be arguments and are now lookups.
Sprint planning. Instead of estimating from scratch, the team looks at what similar tasks took last time. The conversation moves from “how long do you think” to “this one took fourteen hours in March, is this one bigger or smaller”, which people are far better at answering.
Mid-sprint. A task with a four-hour estimate and eleven hours recorded, still in progress, is a signal on day three rather than a surprise on day ten. Nobody has to report being stuck; the data reports it.
Month end. Billable hours are already attached to tasks, which are already attached to projects and clients. The invoice is generated rather than assembled, and when a client asks what they were charged for, the answer is a list of tasks with hours, not a paragraph of reassurance.
Switching tasks without making it a chore
The connection between a task and an hour only exists if somebody selected the task, and every extra second that selection takes is a second of adoption you lose. This is the point where well-designed systems of this kind quietly fail: the model is right, the data flow is right, and nobody uses it because changing what you are working on takes four clicks.
A few things made the difference for us. The tracker keeps recent tasks at the top, because people move between a small set repeatedly rather than across the whole backlog. Switching does not stop and restart the clock — it closes the current entry and opens the next in one action, so there is no gap and nothing to remember. And a task can be started directly from the board, which is where somebody already is when they decide to begin it.
What we avoided was requiring a task. An entry can carry a project without a task, because forcing the selection means people pick something arbitrary to get past the dialog, and an hour attributed to the wrong task is worse than an hour attributed to none. The board data is better when the tagging is optional and easy than when it is mandatory and resented.
Comments are where the reason lives
A task that took three times its estimate raises a question, and the answer is almost never in the numbers. It is in what happened: the client changed their mind, an API was undocumented, a dependency broke.
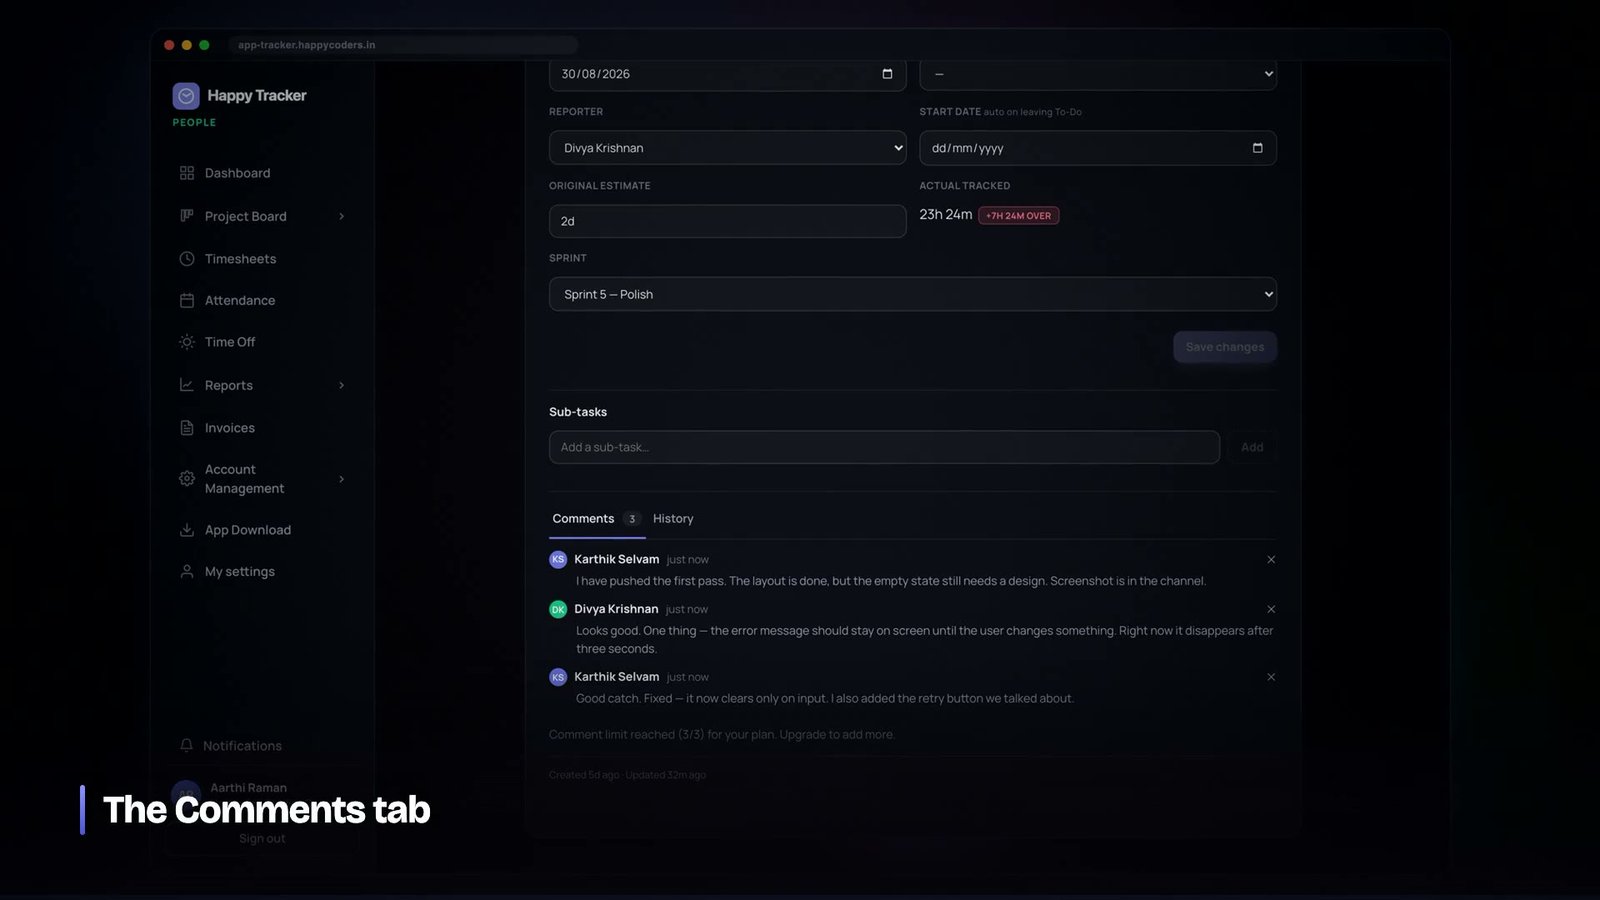
Keeping the discussion on the task rather than in chat is what makes the history worth reading later. Six months on, a task with an estimate, an actual, and a thread explaining the difference is genuinely useful for planning similar work. The same task with the numbers in one tool and the conversation in a chat channel that has since scrolled past is a mystery with a number attached.
We kept comments deliberately plain — text, mentions, and file attachments within a size limit. There is no rich editor, no reactions, no threading within threads. This is not minimalism for its own sake: every feature added to comments pulls the tool towards being a chat application, and it will lose that competition while getting worse at the thing it is for.
Search, and the number people actually remember
Past a few hundred tasks, filters stop being enough and people need to find one specific thing. What they remember is almost always the ticket number, because that is what gets pasted into chat and quoted in standups.
So the search box takes a ticket reference and jumps straight to it, and takes free text and searches titles and descriptions across the organisation rather than only the current board. Searching only the visible board is a small decision that makes the feature useless, because the task somebody is looking for is very often in a different sprint — that is why they cannot see it.
The implementation detail worth stating: search runs on the server with pagination, not by filtering an array the client already loaded. Client-side filtering is faster to build and it silently searches only what happens to be in memory, which produces the worst possible failure — a search that returns results, none of which are the one you wanted, with no indication that it did not look everywhere.
Limits, and why they are per project inside a sprint
Plans in our product cap how many tasks a project may hold in a single sprint. The shape of that limit was chosen carefully and is worth explaining, because the obvious alternatives are both wrong.
A cap on tasks per sprint across the whole organisation punishes exactly the customers you want — the ones running several projects at once — and makes the limit a reason to buy a bigger plan for a bad reason. A cap on total tasks anywhere means a customer eventually cannot create work at all, which turns a pricing tier into a wall.
Per project, per sprint is the version that maps to how the work is actually shaped: it constrains how much can be planned into one cadence for one piece of work, which is a number a team can reason about, and it never prevents anyone from planning the next sprint. Limits that people can predict get accepted; limits that surprise them get complained about, whatever the number is.
The general rule we took from it: when a plan limit has to exist, put it on the dimension the customer already thinks in. A limit expressed in the customer’s own units is a constraint. The same limit expressed in your internal units is an annoyance.
What the board should not become
Once a board carries estimates and actuals, there is pressure to add more. Dependencies, a Gantt view, capacity planning, burndown charts, custom fields, workflow automation. Each request is reasonable in isolation and the destination is a tool that takes a fortnight to configure and that only the project manager understands.
The test we apply is whether a change helps somebody decide what to do next. A card that shows priority, estimate and who owns it helps. A card that shows six custom fields does not, and it makes the five useful ones harder to see.
This is not minimalism as a philosophy. It is that the board competes for attention with a chat window and an inbox, and the moment it takes more than a few seconds to read, people stop opening it and start asking each other what to work on. A board nobody reads is worse than a spreadsheet somebody does.
The backlog is a different surface with different rules
The one place we did allow more density is the backlog and sprint-management view, because the job there is genuinely different. On the board you are deciding what to do today. In the backlog you are planning a fortnight, comparing estimates, moving items between sprints and looking at totals.
Separating those two surfaces meant the board could stay sparse without the planning view becoming inadequate. Trying to serve both from one screen is what produces the tools where a simple daily glance requires scrolling past a planning apparatus nobody needs until Friday.
Two sprints is when it starts working
Teams adopting this ask how long before the data is useful. The honest answer is two sprints, and it is worth saying so, because the first sprint always looks disappointing.
In the first sprint the estimates were made before anybody was watching, tracking is patchy while people build the habit, and the comparison is noisy. In the second, estimates are made by people who have just seen what the first sprint actually took, and the tracking is more complete because the value has become visible. That is where the ratio stabilises and starts being usable for quoting.
Teams that abandon this after one sprint conclude the data is meaningless. They are right about their first sprint and wrong about the tool, and telling them in advance is the difference between adoption and a trial that quietly lapses.
What we would tell anyone building this
- Let a time entry point at a task. One nullable column buys the entire connection.
- Store estimates in the same unit as tracked time. Points cannot be compared to hours, which is why nobody ever compares them.
- Make sprints organisation-level unless you have a strong reason not to. Companies work in one cadence.
- Keep project as a filter, not a parent. Real sprints contain several projects.
- Write down what a day means. Eight hours, in the interface, where people can see it.
- Protect the board. Every field you add to a card costs a little of the scannability that makes it worth having.
- Show planned against actual on the same screen. Two accurate numbers in separate tools are worth less than both together.
The point of joining these two systems is not to police anybody. It is that a team which can see what its work actually cost will estimate better within two sprints, without anyone being asked to try harder — and a team that cannot see it will make the same estimate, and be equally surprised, for years.
Happy Tracker’s board, sprints and timesheets are one system, free for up to five users with no time limit, at happytracker.happycoders.in.