The Disk That Filled Up at 2am: Log Rotation Done Right
The Disk That Filled Up at 2am: Log Rotation Done Right
The site went down at 2am. Not a traffic spike, not a bad deploy, not the database falling over on its own.
$ df -h
Filesystem      Size  Used Avail Use% Mounted on
/dev/sda1        50G   50G     0 100% /

$ ls -lh storage/logs/
-rw-r--r-- 1 www-data www-data  41G Sep 29 01:57 laravel.log
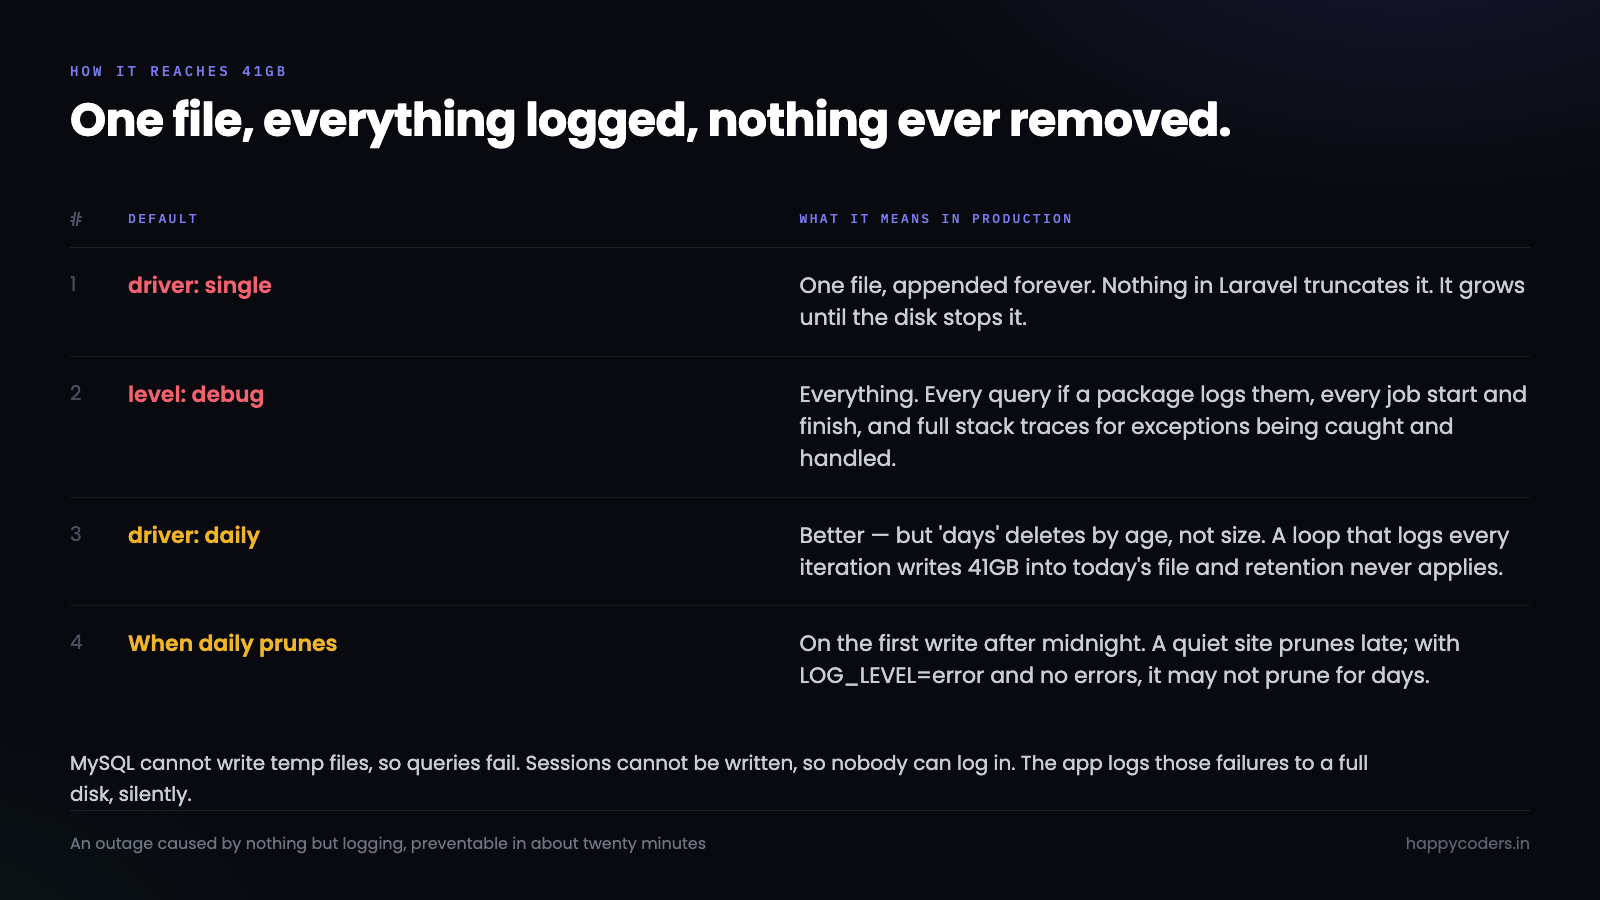
MySQL cannot write its temp files, so queries fail. Sessions cannot be written, so nobody can log in. The application then logs those failures, to a disk that is full, which fails silently.
An outage caused by nothing but logging. It is one of the more embarrassing ways for a site to go down, and it is entirely preventable with about twenty minutes of setup.
Why one file grows forever
// config/logging.php — the default
'single' => [
    'driver' => 'single',
    'path' => storage_path('logs/laravel.log'),
    'level' => env('LOG_LEVEL', 'debug'),
],
One file, appended to, forever. Nothing in Laravel truncates it. It grows until the disk stops it.
The other half of the problem is in the same block: level defaults to debug, which logs everything. In production that usually includes every query if any package is logging them, every job start and finish, and — the one that turns megabytes into gigabytes — full stack traces for exceptions that are being caught and handled.
The daily channel, and what it does not do
'daily' => [
    'driver' => 'daily',
    'path' => storage_path('logs/laravel.log'),
    'level' => env('LOG_LEVEL', 'debug'),
    'days' => 14,
],
This is the usual recommendation and it is right, with a caveat people miss.
days deletes files older than fourteen days. It does not limit how large any one day’s file can get. A loop that logs on every iteration writes 41GB into laravel-2026-09-29.log and the retention setting never comes into it, because the file is not old — it is enormous.
There is also a detail about when the deletion happens: Monolog’s rotating handler prunes when it opens a new file, which is on the first log write after midnight. A site with no traffic overnight prunes late; a site where LOG_LEVEL=error and no errors occur may not prune for days.
So daily bounds the total in the normal case and bounds nothing in the case that actually causes outages.
Bounding the size, not just the age
On a VPS, logrotate is the right tool and it already exists.
# /etc/logrotate.d/laravel
/var/www/app/storage/logs/*.log {
    daily
    rotate 14
    maxsize 100M
    compress
    delaycompress
    missingok
    notifempty
    copytruncate
    su www-data www-data
}
Line by line, because most of these matter:
maxsize 100M is the one the daily channel cannot do — rotate on size even if the day is not over. compress typically gets log text down by 90%, which turns fourteen days of history into something that fits comfortably.
copytruncate copies the file then truncates the original in place, rather than renaming it. That matters because PHP-FPM holds the file handle open: a rename leaves the process writing to a file that no longer has a name, and the new log stays empty until FPM restarts. It is the single most common reason rotation appears to be configured and is not working.
su www-data www-data tells logrotate whose permissions to use. Without it, a rotated file can end up owned by root and the application silently loses the ability to log at all.
Test before trusting it:
logrotate -d /etc/logrotate.d/laravel     # dry run, prints what it would do
logrotate -f /etc/logrotate.d/laravel     # force a rotation now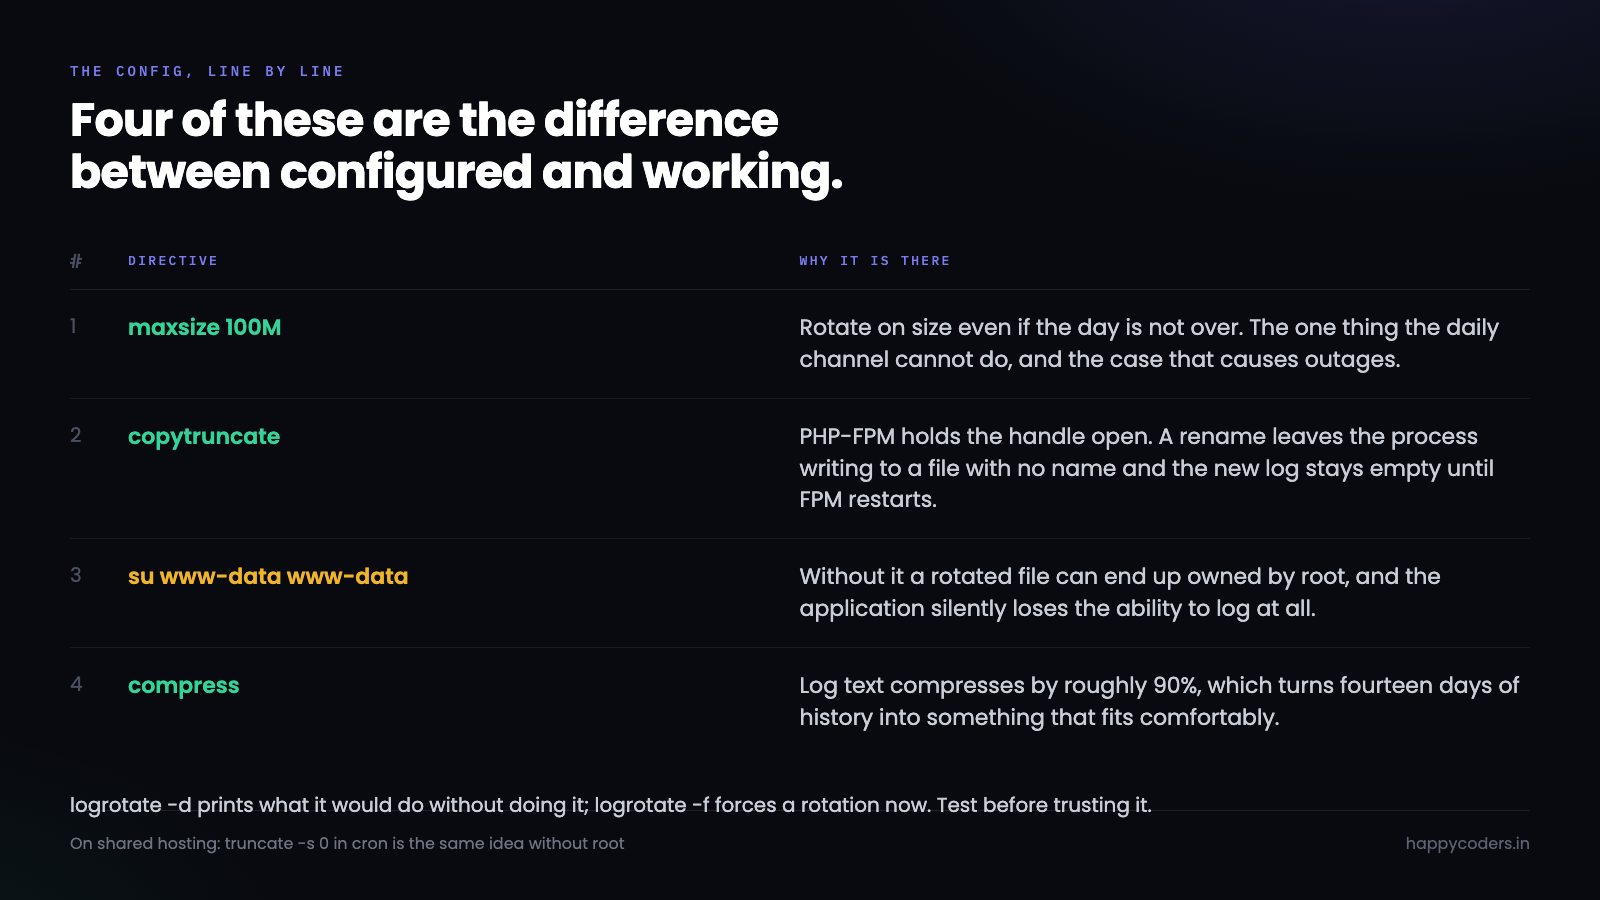
Shared hosting, where there is no logrotate
No root, no /etc/logrotate.d, and often no way to run anything but cron. The daily channel plus a cron job covers it.
#!/usr/bin/env bash
# ~/bin/prune-logs.sh
set -euo pipefail

LOGS=~/app/shared/storage/logs

# delete anything older than 14 days
find "$LOGS" -name '*.log' -type f -mtime +14 -delete

# compress anything older than 2 days that is not already compressed
find "$LOGS" -name '*.log' -type f -mtime +2 -exec gzip -f {} ;

# truncate anything over 100MB, in place, without breaking the handle
find "$LOGS" -name '*.log' -type f -size +100M -exec truncate -s 0 {} ;
0 3 * * * /bin/bash ~/bin/prune-logs.sh >> ~/logs/prune.log 2>&1truncate -s 0 rather than rm is the shared-hosting equivalent of copytruncate — it empties the file while leaving the inode and the open handle intact, so PHP keeps writing to the same file.
Deleting an open log file instead is the mistake that produces the most confusing symptom available: the file is gone from ls, the disk is still full, and df and du disagree. The space is not released until every process holding the handle exits.
Worth adding one line at the top, because a prune script that has silently failed for three months is the same as no prune script:
du -sh "$LOGS" | mail -s "log dir size" you@example.comThe level, which is where the volume comes from
Rotation limits the damage. Logging less removes the cause.
LOG_CHANNEL=daily
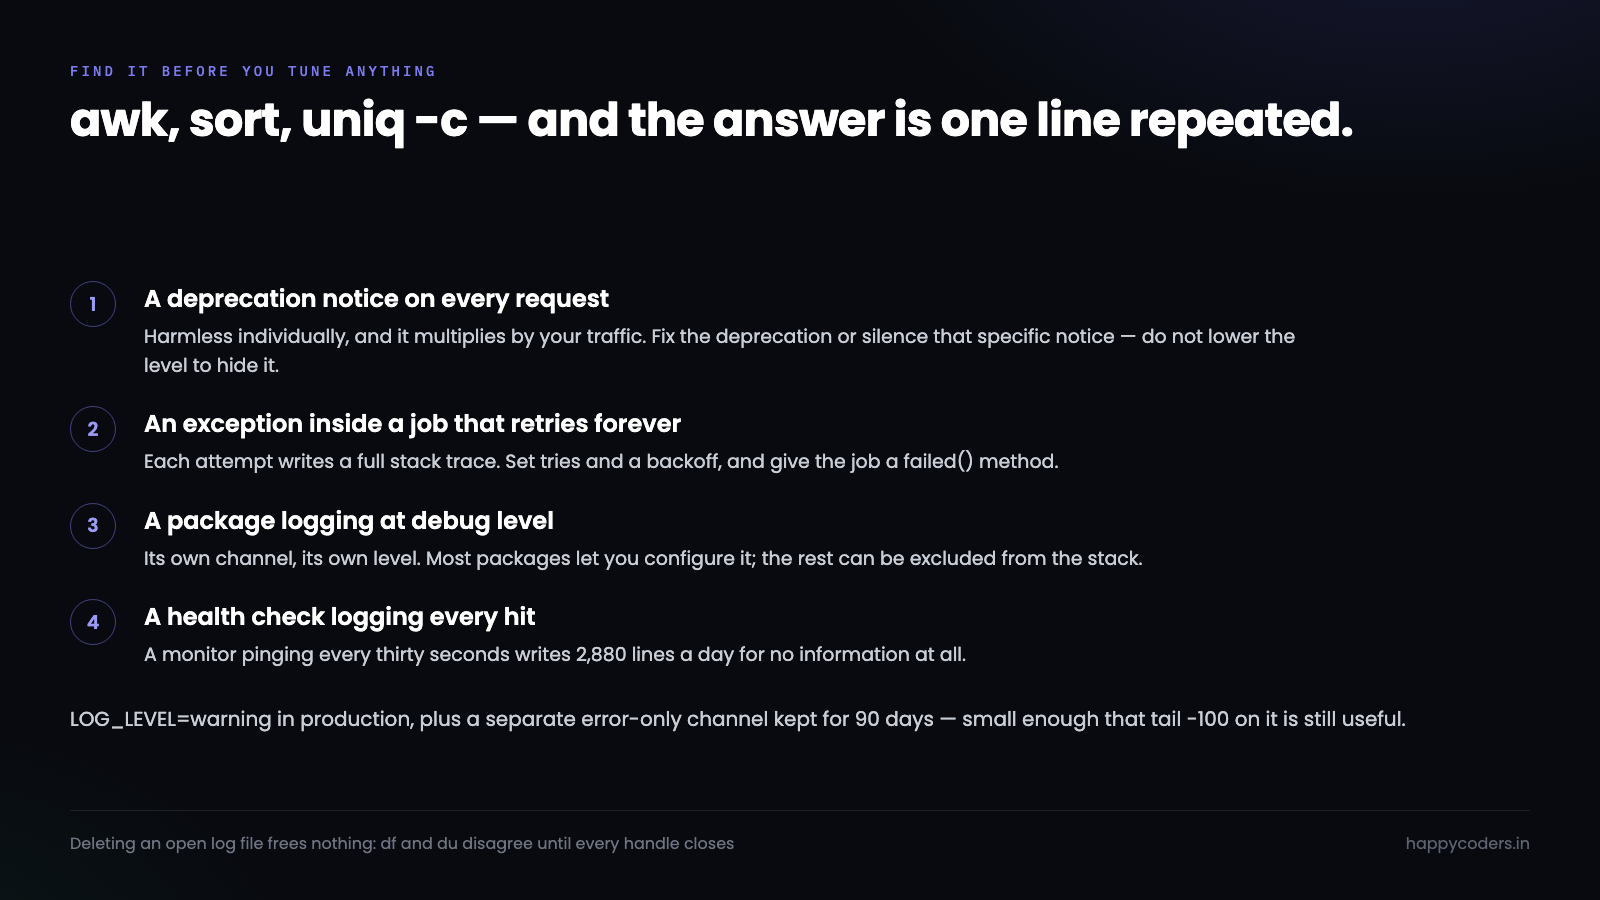
LOG_LEVEL=warning
warning in production is the right default for most applications: warnings, errors and critical, without the info and debug noise that makes up the vast majority of the bytes.
The counter-argument is that debug logs are what you want when something goes wrong, and it is a fair one. The answer is a second channel rather than a lower global level:
'channels' => [
    'stack' => [
        'driver' => 'stack',
        'channels' => ['daily', 'critical'],
    ],

    'critical' => [
        'driver' => 'daily',
        'path' => storage_path('logs/critical.log'),
        'level' => 'error',
        'days' => 90,
    ],
],
Errors are kept for ninety days in a small file that is genuinely readable; everything else rotates out in fourteen. The critical log stays small enough that tail -100 on it is actually useful, which the main log stopped being a long time ago.
What is filling it
Before tuning anything, find out what is actually being written. The answer is usually one thing, repeated.
# the most common messages in the file
awk -F'] ' '{print $2}' laravel.log | sort | uniq -c | sort -rn | head -20

# how much each day wrote
ls -lh storage/logs/

# is one exception responsible
grep -c 'SQLSTATE' laravel.log
In practice it is nearly always one of four: a deprecation notice firing on every request, an exception inside a queued job that retries forever, a third-party package logging at debug level, or a health-check endpoint logging each hit. All four are fixed at the source, and fixing the source is worth more than any amount of rotation.
Logging that never touches the disk
Worth knowing for when the site outgrows files.
'stderr' => [
    'driver' => 'monolog',
    'handler' => StreamHandler::class,
    'with' => ['stream' => 'php://stderr'],
],
Writing to stderr hands the problem to whatever runs the process — the platform’s log collector on a PaaS, journald under systemd, the Docker log driver in a container. Rotation becomes someone else’s configuration, which is the correct outcome when that someone is better equipped than a cron job.
A hosted service — Papertrail, Sentry, a Loki instance — is the other direction, and the argument for it is not really rotation. It is that searching across three servers and ninety days is not something grep does well, and that alerting on a pattern is something files cannot do at all.
Neither is necessary for a single small site. Both become obviously worth it around the point where you have started writing scripts to grep several log files at once.
The logs that are not Laravel’s
Fixing storage/logs and then filling the disk anyway is a common second act, because an application writes to more places than its own log directory.
du -sh ~/* ~/.* 2>/dev/null | sort -h | tail -20
du -sh /var/log/* 2>/dev/null | sort -h | tail -10
The usual offenders, in rough order of how often they are the answer:
PHP’s own error log. Set by error_log in php.ini, often in the account root or the document root, and completely separate from Laravel’s. It collects fatals and warnings that never reach Monolog, and nothing rotates it by default. On shared hosting it is frequently ~/logs/error_log and frequently the largest file on the account.
The web server’s access log. Under a panel this is usually rotated for you, and worth confirming rather than assuming — a busy site writes hundreds of megabytes a week of access log alone.
MySQL’s slow query log. Enabled once during an investigation, left on, with long_query_time at 0 or the general log switched on by mistake. The general log writes every statement and can outgrow the application log in hours.
Failed jobs and the sessions table. Not files, and they fill a disk the same way. failed_jobs with no pruning and a database session driver with no cleanup both grow without limit. php artisan queue:prune-failed --hours=168 on a schedule handles the first.
Laravel’s scheduler covers the ones inside the application:
$schedule->command('queue:prune-failed --hours=168')->daily();
$schedule->command('telescope:prune --hours=48')->daily();
$schedule->command('model:prune')->daily();
Telescope deserves a specific mention: it is enormously useful in development and writes several rows per request. Left enabled in production without pruning, it fills a database rather than a disk, and it does it faster than any log file.
Knowing before the disk does
Everything above is prevention. The remaining gap is that none of it tells you when it has failed.
#!/usr/bin/env bash
# ~/bin/disk-check.sh
USED=$(df --output=pcent ~ | tail -1 | tr -dc '0-9')

if [ "$USED" -gt 85 ]; then
    { echo "Disk at ${USED}% on $(hostname)"; echo; du -sh ~/* | sort -h | tail -10; }         | mail -s "Disk warning: ${USED}%" you@example.com
fi
0 */6 * * * /bin/bash ~/bin/disk-check.shFour times a day, and it includes the ten largest directories so the mail itself usually contains the answer. The threshold matters: 85% gives room to act, while an alert at 95% on a fast-filling disk arrives at roughly the same time as the outage.
A health-check endpoint is the other half, for the case where email is what is broken:
Route::get('/health', function () {
    $free = disk_free_space(base_path());
    $total = disk_total_space(base_path());
    $pct = 100 - ($free / $total * 100);

    return response()->json([
        'disk_used_percent' => round($pct, 1),
        'status' => $pct > 90 ? 'critical' : ($pct > 80 ? 'warning' : 'ok'),
    ], $pct > 90 ? 503 : 200);
});
Returning 503 above 90% means any uptime monitor already pointed at the site reports it, without configuring anything new. And, per the earlier point about health checks: exclude this route from logging, or it becomes the thing filling the disk.
Writing log lines that are worth keeping
The volume argument has a quality argument attached to it: a smaller log is only an improvement if what remains is useful.
// what most code does
Log::error('Payment failed');

// what you want at 2am
Log::error('Payment capture failed', [
    'invoice_id' => $invoice->id,
    'gateway'    => 'razorpay',
    'gateway_id' => $response->id,
    'amount'     => $invoice->amount,
    'reason'     => $response->error_description,
]);
The second costs one line and turns the log into something you can query. The first tells you a payment failed, which you already knew from the support ticket.
The rule that follows: put identifiers in the context array, not in the message. A message with the invoice id interpolated into it is a unique string, so uniq -c cannot group it and you cannot tell whether this happened once or four hundred times. A stable message with the id in context gives you both.
For a request that touches several services, a correlation id is what makes the lines findable together:
// middleware
Log::withContext(['request_id' => Str::uuid()->toString()]);
Every subsequent line in that request carries it, including from a queued job if you pass it along. Grepping one id then reconstructs the whole path, which is the difference between reading a log and searching one.
One thing to keep out: anything you would not want in a file that sits on disk for fourteen days and gets copied into a support email. Passwords, tokens, card numbers, full request bodies from an auth endpoint. Laravel’s $dontFlash covers the validation case; logging a whole request object yourself bypasses it entirely, and that is how credentials end up in a log nobody thought of as sensitive.
Recovering from the full disk itself
All of the above assumes you get there first. If you are reading this because the disk is already at 100%, the order matters.
# 1. reclaim space without killing anything
truncate -s 0 storage/logs/laravel.log

# 2. find what else is large
du -sh /* 2>/dev/null | sort -h | tail
du -sh ~/* 2>/dev/null | sort -h | tail

# 3. deleted-but-open files still holding space
lsof +L1 2>/dev/null | head
truncate first, because it is instant and safe with processes still writing. Resist the urge to rm the log — on a full disk that is the move that makes df report free space while nothing actually improves, since the handle is still open.
That third command is the one worth remembering. lsof +L1 lists files with no directory entry but an open handle, which is exactly the “deleted 30GB and nothing changed” situation. Restarting the process holding the handle — usually PHP-FPM — releases it immediately.
The twenty minutes
Set LOG_CHANNEL=daily and LOG_LEVEL=warning. Add logrotate with maxsize and copytruncate, or the cron script if there is no root. Run it once by hand to confirm it works. Then spend ten minutes on uniq -c to find whatever is writing the same line a million times, and fix that.
The 2am outage at the top was not really a logging problem. It was that nothing in the system had an upper bound, and a thing with no upper bound eventually finds the machine’s.