Reading a Slow Query Log Without Guessing
Reading a Slow Query Log Without Guessing
Somebody says the application feels slow. You open the slow query log for the first time, find a report that took eleven seconds, add an index, and deploy.
Nothing changes, because that report runs once a month.
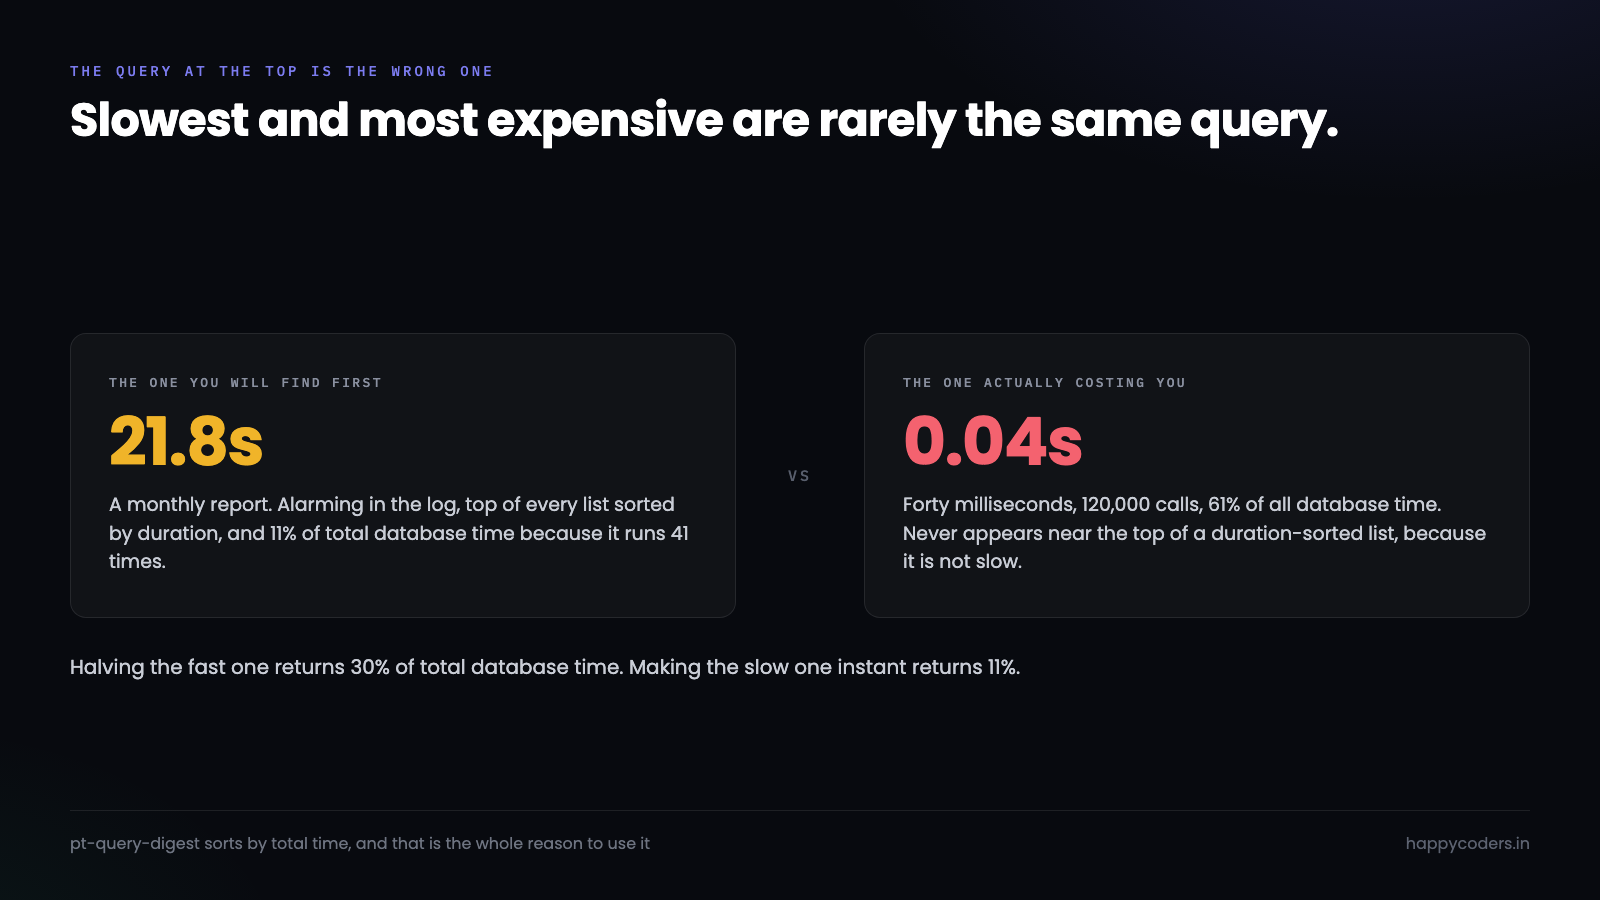
Meanwhile a query taking forty milliseconds runs two hundred times a second and is consuming more database time than everything else combined. It never appears near the top of any list sorted by duration, because individually it is not slow at all.
Turning it on without making things worse
The log can be enabled at runtime, with no restart, which is the first useful thing to know.
SET GLOBAL slow_query_log = 'ON';
SET GLOBAL slow_query_log_file = '/var/log/mysql/slow.log';
SET GLOBAL long_query_time = 0.5;       -- seconds; accepts fractions
SET GLOBAL log_queries_not_using_indexes = 'OFF';
Three of those deserve explanation.
long_query_time defaults to 10 seconds, which is far too high to be useful — anything taking ten seconds is already a visible outage. Half a second is a sensible starting point on a web application. You will lower it later.
log_queries_not_using_indexes sounds helpful and is a trap on a busy server. Every small table scan gets logged, including the ones that are correct because the table has forty rows. The log fills with noise, the disk fills with log, and the genuinely slow queries are buried. Leave it off until you have a specific reason.
And the file: check the disk has room before enabling, and make sure log rotation covers it. A slow query log that fills the volume the database lives on turns a performance investigation into an outage.
The log is written synchronously. On a server already struggling, a very low threshold can measurably slow the thing you are trying to measure.
What a log entry actually says
A raw entry looks like this, and most of the value is in the header rather than the SQL.
# Time: 2026-09-29T04:12:07.184213Z
# User@Host: happytracker[happytracker] @ localhost []
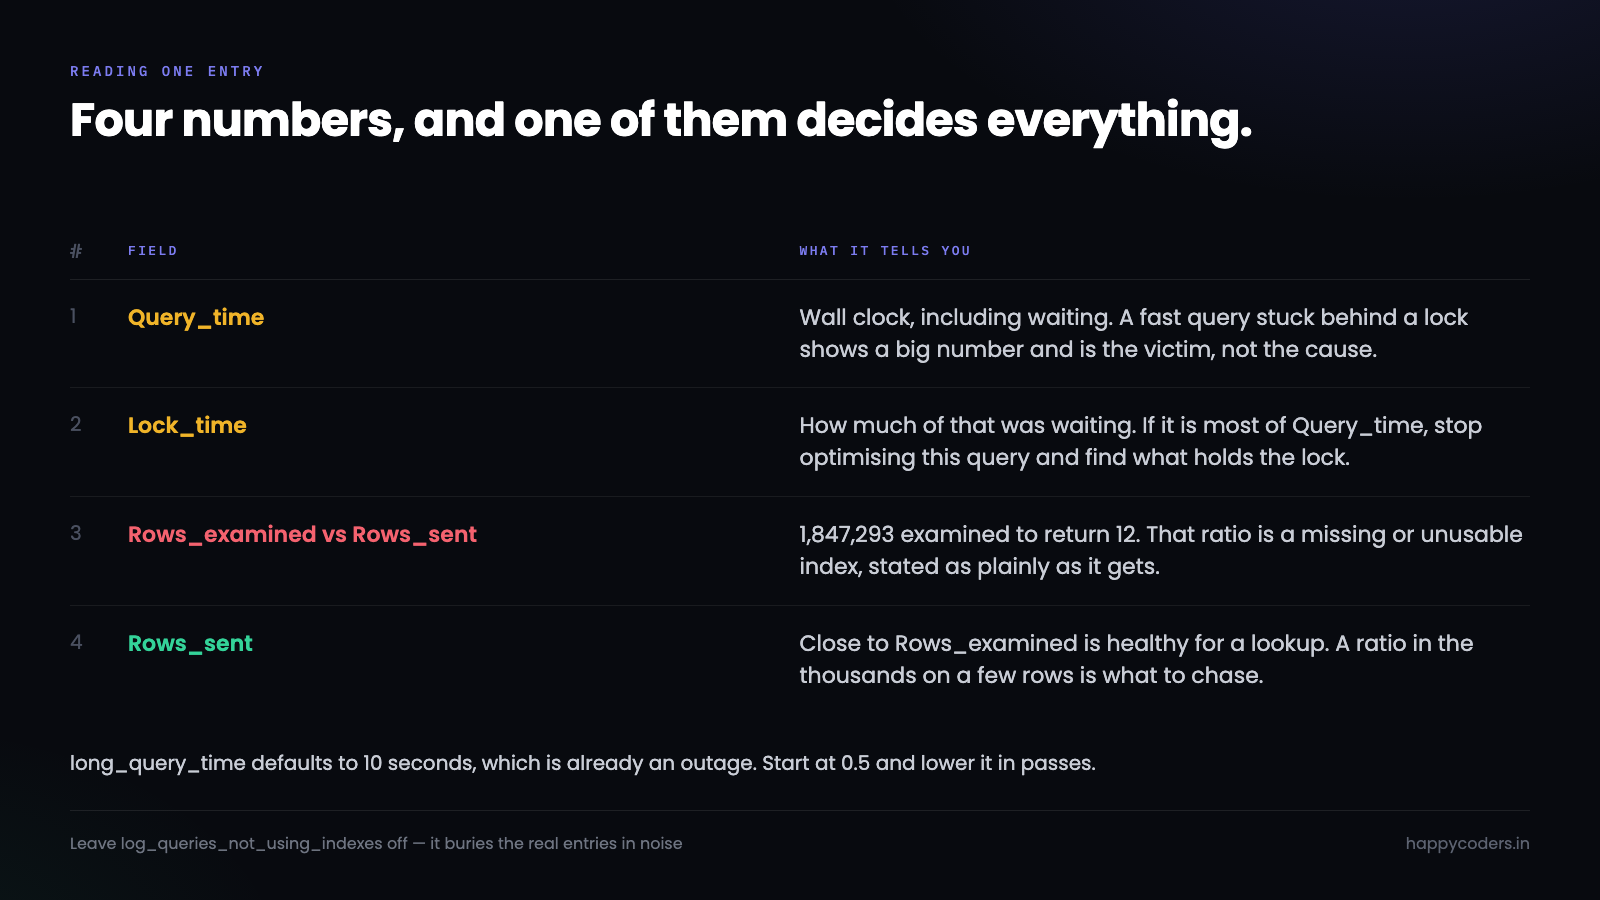
# Query_time: 2.847291  Lock_time: 0.000184  Rows_sent: 12  Rows_examined: 1847293
SET timestamp=1790654327;
SELECT p.name, SUM(t.minutes) FROM time_entries t
  JOIN projects p ON p.id = t.project_id
  WHERE t.organization_id = 42 AND t.started_at >= '2026-09-01'
  GROUP BY p.name;
Query_time is wall clock, including time spent waiting. A query that is fast but blocked behind a lock shows a large number here and is not itself the problem.
Lock_time is how much of that was waiting for locks. If Lock_time is most of Query_time, stop optimising this query — something else is holding a lock and this is the victim.
Rows_examined versus Rows_sent is the ratio that matters most. Twelve rows returned after examining 1.8 million means the database read almost two million rows to find twelve. That is a missing or unusable index, stated as plainly as it ever gets stated.
A healthy ratio is close to 1:1 for a lookup, and inevitably larger for an aggregate. A ratio in the thousands on a query returning a handful of rows is the signal worth chasing.
Aggregate before you read
Reading the raw log by eye works for about ten entries. Past that you need it grouped, and the tool for that is pt-query-digest from Percona Toolkit.
pt-query-digest /var/log/mysql/slow.log > digest.txtIt normalises queries — replacing literal values with placeholders so the same query with different parameters groups together — and sorts by total time rather than by individual duration. That one change in sort order is the whole point.
# Profile
# Rank Query ID           Response time   Calls  R/Call  Item
# ==== ================== =============== ====== ======= ==================
#    1 0x3A99CC42... 4820.1  61.2%  120503  0.0400 SELECT time_entries
#    2 0x7B2F1E08...  892.4  11.3%      41 21.7659 SELECT time_entries projects
#    3 0x9C4D2A11...  611.8   7.8%   30590  0.0200 SELECT screenshots
Rank 1 takes forty milliseconds per call and is 61% of all database time. Rank 2 takes twenty-two seconds per call and is 11%. Every instinct says fix the twenty-two second query. The arithmetic says fix the forty-millisecond one, and the arithmetic is right.
Halving rank 1 gives back 30% of total database time. Making rank 2 instant gives back 11%. And rank 1 is on a page users load constantly, so the improvement is one they feel.
Then ask the database what it did
Once you have a query worth fixing, EXPLAIN tells you why it is slow. EXPLAIN ANALYZE on MySQL 8 tells you what actually happened rather than what the optimiser predicted, which is usually the more useful of the two.
EXPLAIN ANALYZE
SELECT p.name, SUM(t.minutes) FROM time_entries t
  JOIN projects p ON p.id = t.project_id
  WHERE t.organization_id = 42 AND t.started_at >= '2026-09-01'
  GROUP BY p.name;
Four things in the output carry most of the meaning.
type tells you how a table is reached. const and eq_ref are ideal, ref and range are fine, index means a full index scan, and ALL means a full table scan. One ALL on a large table explains almost any slow query on its own.
key is the index chosen. NULL here with a large rows value is the problem stated directly.
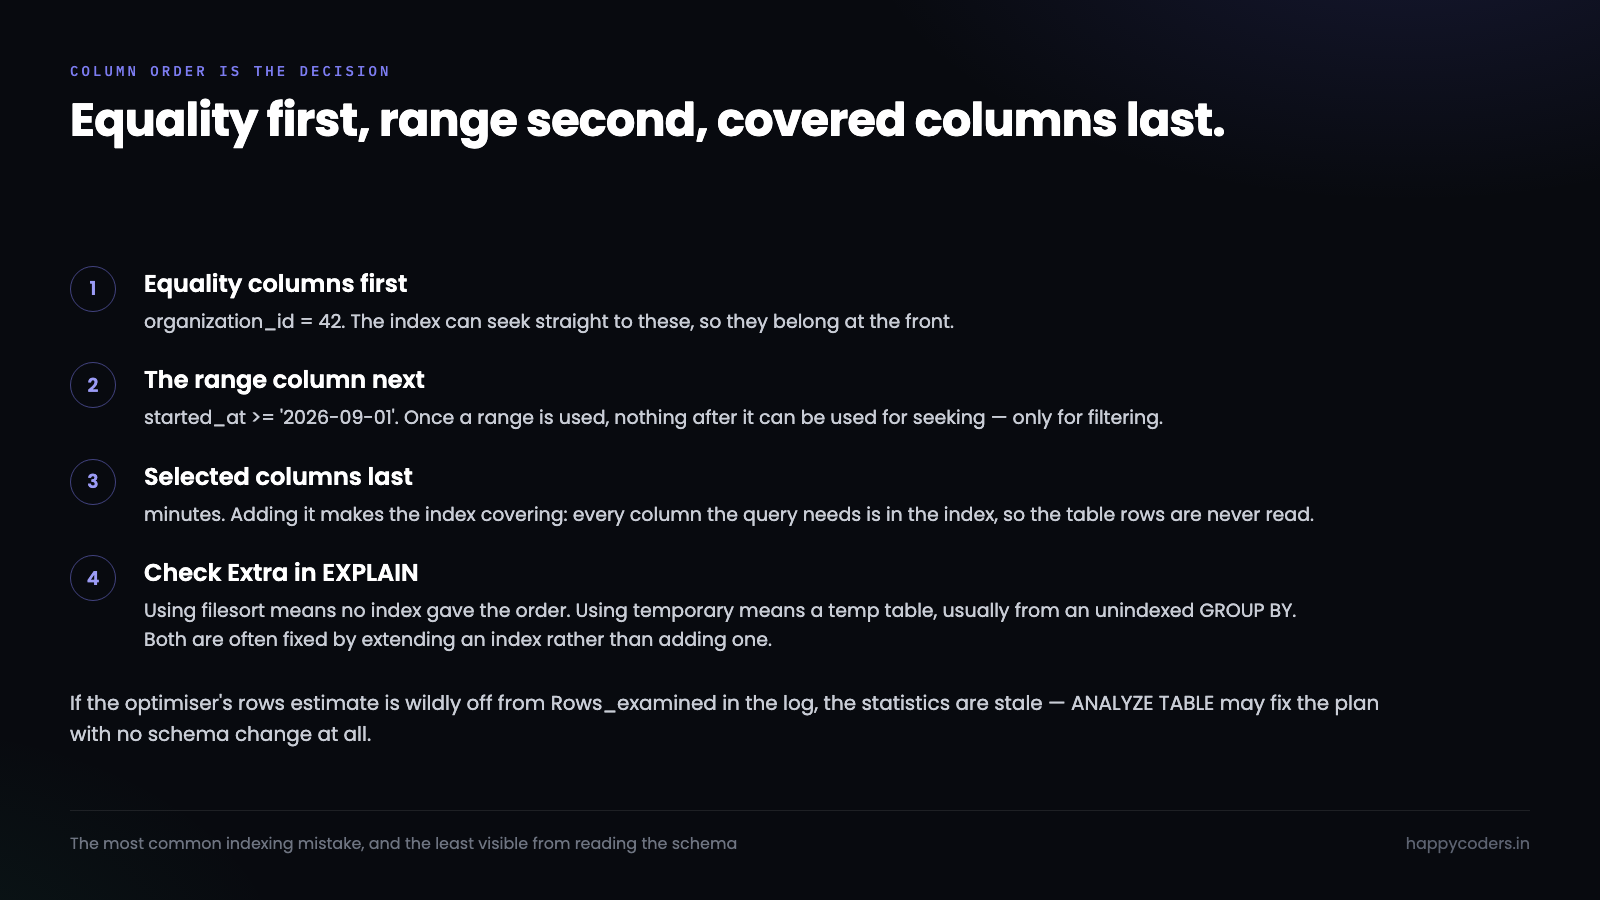
rows is the optimiser’s estimate. If it is wildly different from Rows_examined in the log, the table statistics are stale and ANALYZE TABLE may fix the plan without any schema change at all.
Extra is where the expensive work hides. Using filesort means sorting in memory or on disk because no index provided the order. Using temporary means a temporary table, usually from GROUP BY on something unindexed. Both are often fixable by extending an existing index rather than adding a new one.
The index that would have helped
For the query above, the useful index is composite and the column order is the entire decision.
-- Equality first, then the range, then anything only being selected
ALTER TABLE time_entries
  ADD INDEX idx_org_started (organization_id, started_at, minutes);
Equality columns go first because the index can seek straight to them. The range column goes next, because once a range is used, no column after it can be used for seeking — only for filtering. And minutes on the end makes it a covering index: every column the query needs is in the index, so the database never touches the table rows at all.
Reverse those first two and the index becomes nearly useless for this query, which is the most common indexing mistake there is and the least obvious from reading the schema.
The performance schema, when the log is not enough
The slow query log is a file you read after the fact. MySQL’s performance schema answers questions about right now, and the summary tables are the useful part rather than the raw events.
-- The same "total time, not per-call time" ranking, live, no log file
SELECT
    DIGEST_TEXT,
    COUNT_STAR                          AS calls,
    ROUND(SUM_TIMER_WAIT/1e12, 1)       AS total_seconds,
    ROUND(AVG_TIMER_WAIT/1e9, 1)        AS avg_ms,
    SUM_ROWS_EXAMINED / NULLIF(SUM_ROWS_SENT, 0) AS examined_per_row
FROM performance_schema.events_statements_summary_by_digest
ORDER BY SUM_TIMER_WAIT DESC
LIMIT 10;
This gives the digest without running pt-query-digest, without a log file, and without the write overhead of logging. The catch is that it resets when the server restarts and it has a finite number of digest slots, so a server with thousands of distinct query shapes will start lumping the rare ones together.
For a quick look it is the fastest route there is. For a week-long picture across restarts, the log is still the thing.
The examined_per_row column in that query is the same ratio from the log header, computed across all calls. Sorting by it rather than by time finds a different and useful list: queries that are not slow yet but are reading far more than they return, which are the ones that become slow as the table grows.
The query that will hurt you next quarter is usually already visible this quarter, as a bad rows-examined ratio on a table that is still small.
Checking the index actually got used
Adding an index and seeing the query get faster is not proof the index is why. A different plan, a warm buffer pool or a quieter moment all produce the same result.
-- Which indexes are being used, and which are dead weight
SELECT OBJECT_NAME AS tbl, INDEX_NAME, COUNT_STAR AS uses
FROM performance_schema.table_io_waits_summary_by_index_usage
WHERE OBJECT_SCHEMA = DATABASE() AND INDEX_NAME IS NOT NULL
ORDER BY COUNT_STAR ASC;
Sorted ascending, the top of that list is indexes nobody is using. Each one costs write time on every insert and update, and space in the buffer pool that a useful index could have occupied.
Unused indexes accumulate quietly — added for a query that was later rewritten, or copied from a similar table. Checking this list once a quarter usually finds two or three, and dropping them makes writes faster for free.
What the log will not tell you
Three real problems are invisible here, and it is worth knowing so you do not conclude the database is fine.
The N+1. Two hundred queries of two milliseconds each is four hundred milliseconds of page time and not one of them crosses any threshold. Set long_query_time = 0 for sixty seconds on a quiet moment to capture everything, digest that, and the repetition becomes obvious — one query with an enormous call count.
Connection overhead. If the application opens a connection per request and the handshake is slow, the queries all look fine and the page does not.
Waiting on something else. A query blocked behind a long transaction shows a large Query_time and a large Lock_time. The fix is in whatever holds the lock, which will not be in the log at all if it was fast.
-- What is actually waiting, right now
SELECT * FROM performance_schema.data_lock_waits;
SHOW ENGINE INNODB STATUSG   -- see the TRANSACTIONS section
When the fix is not an index
Indexing is the first answer and it is not always the right one. Three cases come up often enough to recognise.
The query asks for too much. A report that aggregates two years of rows to draw a chart of the last month is reading 24 times what it needs. No index fixes a wrong WHERE clause; the fix is in the query, not the schema.
The result never changes. A dashboard tile showing last month’s total recomputes the same aggregate on every page load. Nothing about last month is going to change. Cache it, or write it to a summary table once a night.
// The cheapest optimisation is the query you do not run
Cache::remember("org:{$id}:totals:2026-09", now()->addHours(6), fn () =>
    TimeEntry::where(...)->sum('minutes')
);
The table has outgrown the shape. Once a table is large enough that even a good index is reading millions of rows, the answer is usually a pre-aggregated table — daily totals per project per user, written as entries arrive or rolled up nightly. Queries then read thousands of rows instead of millions, and the slow query disappears rather than getting faster.
That last one is a real piece of work and it is worth resisting until the evidence is there. A summary table is another thing to keep correct, and a wrong summary is harder to notice than a slow query.
Reading it on a managed database
On RDS, Cloud SQL or a managed MySQL, you often cannot read the file directly, and the knobs are in a parameter group rather than a SET GLOBAL.
The usual arrangement is to set log_output = 'TABLE', which writes entries to mysql.slow_log and makes them queryable:
SELECT start_time, query_time, rows_examined, rows_sent,
       CONVERT(sql_text USING utf8) AS sql_text
FROM mysql.slow_log
ORDER BY query_time DESC
LIMIT 20;
Two warnings. The table has no index, so this query gets slow once the table is large — rotate it with CALL mysql.rds_rotate_slow_log() or the equivalent. And pt-query-digest cannot read it directly, so dump it to a file first if you want a proper digest.
On shared hosting, which is where a lot of small applications actually live, you often have none of this. The fallback is to log slow queries from the application instead — a listener that records anything over a threshold, with the route and the user, into a table of your own. It is less precise than the database’s own view and it has one real advantage: it knows which page the query came from, which the server log never does.
A routine that works
Turn the log on at half a second and leave it for a full week, not a day. Weekly patterns are real — Monday morning, month-end reporting — and a Tuesday afternoon sample will miss them.
Digest the week and look only at the top five by total time. Fix those. Ignore everything below, however alarming the individual durations look.
Then lower the threshold to a tenth of a second and repeat. Each pass surfaces a different layer, and the queries that matter at 0.1s are rarely the ones that mattered at 0.5s.
Once a quarter, capture everything for sixty seconds with the threshold at zero. That is the pass that finds the N+1s, and it is the one nobody does because it requires deliberately logging a lot for a short time.
Keep the digest files. A query that was 3% of database time last quarter and is 20% this quarter has a story behind it — a table that grew, an index that stopped being used, a feature that got popular — and you will only see that if you kept the earlier number.