Why a Screen Recording Drops Frames, and How We Measured It
Why a Screen Recording Drops Frames, and How We Measured It
A user reports that recordings look stuttery. The settings say 60 frames per second. The file, inspected, contains 41 frames per second on average, with gaps. Nothing in the application logged an error.
Dropped frames are almost never one bug. They are a queue somewhere filling up, and the useful question is which queue. This is how we instrumented ours, what the numbers said, and which fixes actually changed the output.
The pipeline, and where a frame can die
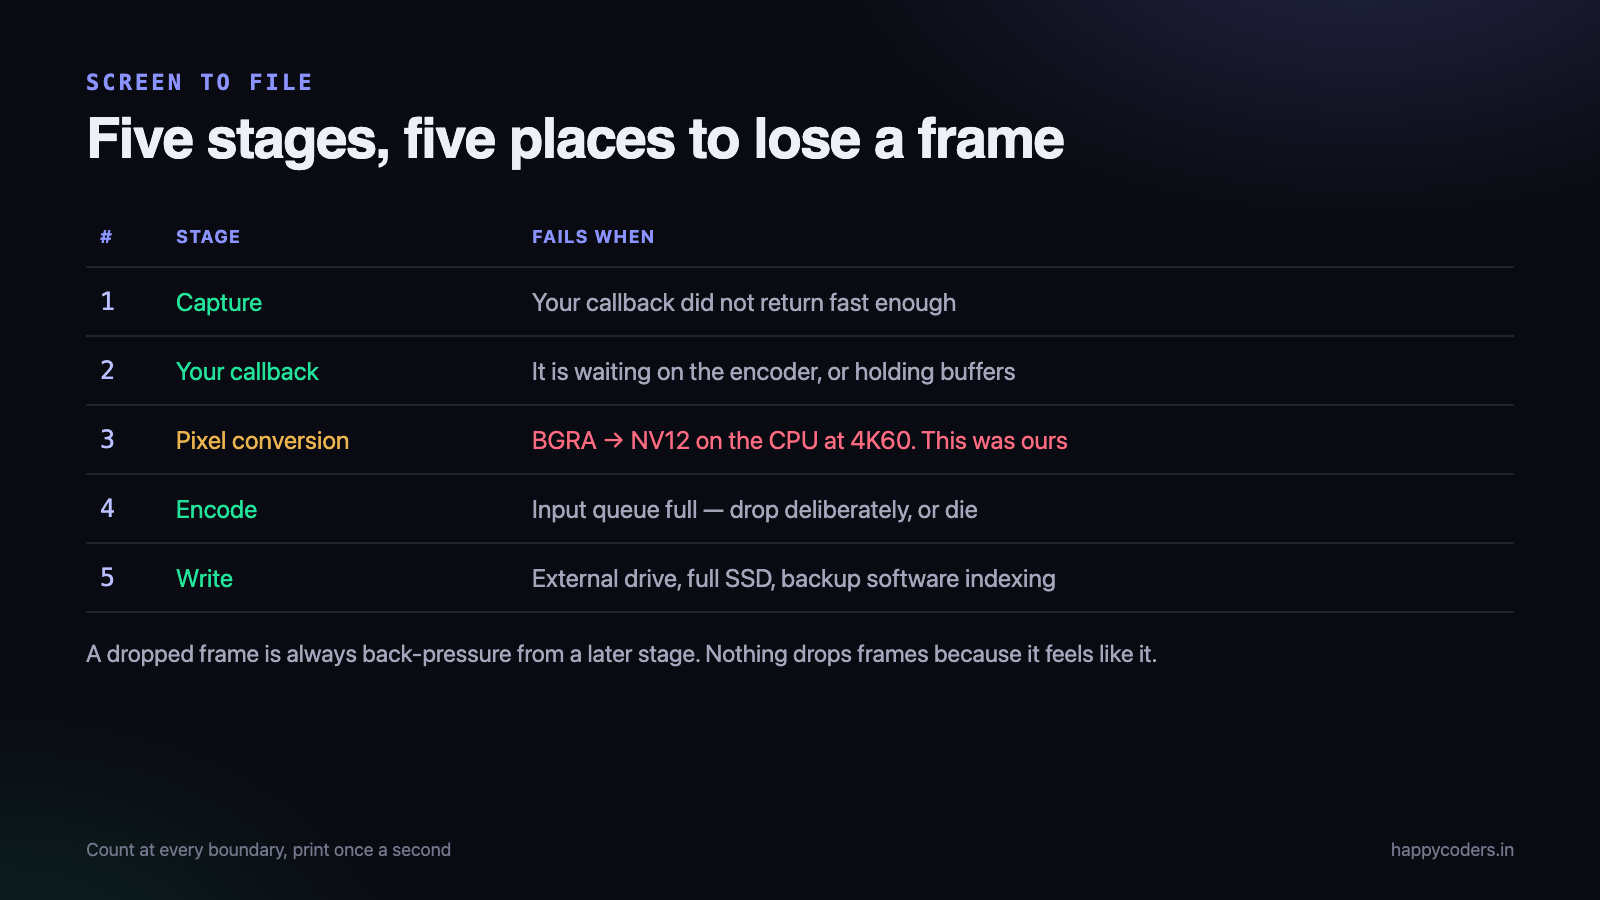
Between a pixel changing on screen and a frame existing in an MP4 there are five distinct stages, each with its own buffer.
- Capture. The operating system delivers a frame to your callback. On macOS this is ScreenCaptureKit; on Linux, a PipeWire stream. Both have a queue in front of your handler.
- Your callback. Whatever you do with the sample buffer. If this is slow, the queue behind it grows.
- Pixel conversion. The capture format and the encoder’s input format are frequently different, and a conversion happens somewhere.
- Encode. The hardware or software encoder takes a frame and produces compressed output, with its own input queue.
- Write. Compressed frames go to disk, through the container writer and the filesystem.
The rule that makes debugging tractable: a dropped frame is always caused by back-pressure from a later stage. Nothing drops frames because it feels like it. If capture is dropping, it is because your callback did not return quickly enough. If your callback is slow, it is usually waiting on the encoder.
Count at every stage, not at the end
The single most useful change we made was cheap: a counter at each boundary, and a periodic line in the log.
final class FrameStats {
    private let q = DispatchQueue(label: "stats")
    private var captured = 0, converted = 0, encoded = 0, written = 0
    private var droppedByOS = 0, droppedByUs = 0

    func captured(_ n: Int = 1)     { q.async { self.captured  += n } }
    func droppedByOS(_ n: Int = 1)  { q.async { self.droppedByOS += n } }
    func droppedByUs(_ n: Int = 1)  { q.async { self.droppedByUs += n } }
    func encoded(_ n: Int = 1)      { q.async { self.encoded   += n } }
    func written(_ n: Int = 1)      { q.async { self.written   += n } }

    func snapshotAndReset() -> String {
        q.sync {
            defer { captured = 0; converted = 0; encoded = 0
                    written = 0; droppedByOS = 0; droppedByUs = 0 }
            return "cap \(captured) osDrop \(droppedByOS) weDrop \(droppedByUs) " +
                   "enc \(encoded) wrote \(written)"
        }
    }
}
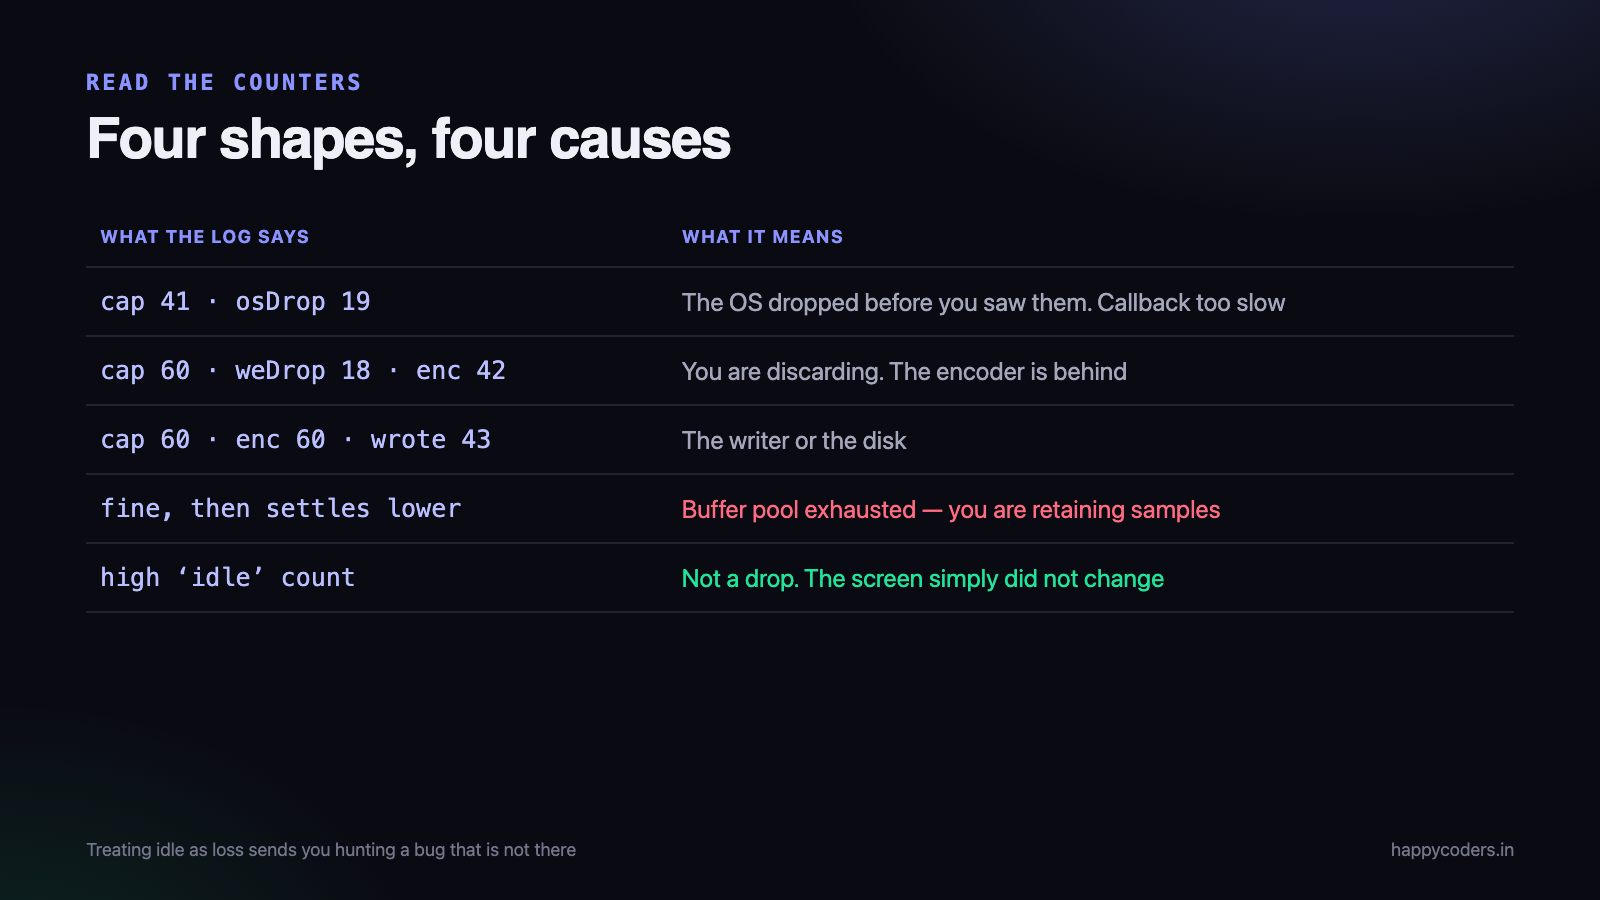
Log the snapshot once a second while recording. The shape of the numbers tells you where the loss is, immediately:
- cap 41, osDrop 19 — the OS is dropping before you see the frames. Your callback is too slow, or you are holding buffers.
- cap 60, weDrop 18, enc 42 — you are discarding frames because the encoder is behind.
- cap 60, enc 60, wrote 43 — the writer or the disk is the bottleneck.
Before this, we were guessing. After it, every report of stuttering came with a log line that named the stage.
Stage one: the capture callback
The most common cause, and the one that is easiest to get wrong, is doing real work inside the callback the OS calls.
The system hands you a sample buffer and expects the callback to return quickly. If it does not, the frames that arrive meanwhile are discarded — and on macOS you are told, which is worth listening to.
func stream(_ stream: SCStream,
            didStopStreamWithError error: Error) { ... }

// this one is the useful signal, and it is easy not to implement
func stream(_ stream: SCStream,
            didOutputSampleBuffer sb: CMSampleBuffer,
            of type: SCStreamOutputType) {
    guard type == .screen, CMSampleBufferIsValid(sb) else { return }

    // SCStreamFrameInfo tells you what the OS thought of this frame
    if let attachments = CMSampleBufferGetSampleAttachmentsArray(sb, createIfNecessary: false)
            as? [[SCStreamFrameInfo: Any]],
       let statusRaw = attachments.first?[.status] as? Int,
       let status = SCFrameStatus(rawValue: statusRaw) {

        switch status {
        case .complete:  break                  // a real frame
        case .idle:      return                 // nothing changed on screen
        case .blank, .suspended, .started:
            stats.droppedByOS(); return
        @unknown default: return
        }
    }

    encoder.submit(sb)      // returns immediately; see below
}
Two things worth noticing. The .idle status is not a dropped frame — it means the screen did not change, which is extremely common in screen recording and should not be counted as loss. Teams that treat idle as a drop conclude they have a catastrophic problem and go looking for a bug that is not there.
And encoder.submit must not block. The moment the callback waits on anything — a lock, an allocation, a disk write — the capture queue starts filling.
Stage two: holding onto buffers
This one cost us two days. The capture system works from a finite pool of pixel buffers. If your code retains them — because you queued the CMSampleBuffer itself, or kept a reference for a preview — the pool empties and the OS has nothing to write the next frame into.
The symptom is distinctive: recording starts fine and degrades after a few seconds, settling at a stable lower rate. That pattern almost always means a pool being exhausted rather than a CPU limit.
The fix is to copy what you need and release the original immediately, or to make sure your consumer is genuinely faster than the producer so nothing queues at all.
Stage three: the pixel format conversion nobody planned
Capture gives you one pixel format. The encoder wants another. If they do not match, a conversion happens — and where it happens decides whether it is nearly free or ruinous.
A conversion on the CPU for 3840×2160 at 60fps is hundreds of megabytes a second of work, and it will not keep up. The same conversion done by the GPU, or avoided entirely by asking capture for the format the encoder wants, costs almost nothing.
// ask capture for the format the encoder actually wants
config.pixelFormat = kCVPixelFormatType_420YpCbCr8BiPlanarVideoRange
This was our single largest win, and it was one line. Before it we were converting BGRA to NV12 in software on every frame; afterwards there was no conversion at all. The frame rate went from the low forties to a steady sixty on the same machine.
It is worth checking this early on any capture pipeline, because it is invisible — nothing logs “by the way, a format conversion is happening”, and the cost only becomes obvious at high resolutions.
Stage four: the encoder, and what to do when it is behind
Hardware encoders are fast but not infinitely fast, and they have an input queue. At 4K60 on a laptop that is also running the application being recorded, it is entirely possible to produce frames faster than the encoder consumes them.
When that happens you have three options, and the choice matters more than it looks:
- Block the producer. Never do this in a capture callback. It converts an encoder problem into a capture problem, and now the OS drops frames instead of you — with no control over which.
- Queue without limit. Memory grows until the process is killed. A forty-minute recording ends at minute nine.
- Drop deliberately, and record that you did. A bounded queue, and when it is full you discard the oldest pending frame and increment a counter.
The third is the only defensible answer. A recording at 44fps that plays smoothly is better than one that stutters unpredictably, and far better than a process that dies. What matters is that the drop is yours, so timestamps stay correct and the counter tells the user what happened.
func submit(_ frame: CVPixelBuffer, at pts: CMTime) {
    guard pending.count < maxPending else {
        pending.removeFirst()          // drop the oldest, keep moving
        stats.droppedByUs()
        pending.append((frame, pts))
        return
    }
    pending.append((frame, pts))
    drain()
}
Timestamps: the part that makes drops invisible
A dropped frame only causes visible stutter if the remaining frames carry the wrong timing. If every frame keeps the presentation timestamp it was captured with, a gap is simply a frame held slightly longer, and the playback speed stays correct.
The failure mode is a recorder that assumes a constant interval and stamps frames as 0, 1/60, 2/60 and so on. Drop ten frames and the video is now shorter than the audio, drifting further apart as the recording continues. This is the real cause of most “audio is out of sync” reports in screen recorders, and it is not an audio bug at all.
Use the timestamp the capture system gave you. Always.
Stage five: the disk
Rarest, but it happens, and it produces a distinctive pattern — long periods of perfect capture punctuated by bursts of loss.
- Writing to an external drive over USB, or worse, a network volume.
- A nearly full SSD, where write performance collapses.
- Backup software indexing the file as it is being written.
- Writing at a bitrate the drive cannot sustain — 4K ProRes is hundreds of megabytes per second.
Log the write duration per segment. If it is usually 2ms and occasionally 400ms, the disk is your problem and no amount of encoder tuning will help.
What actually mattered, in order
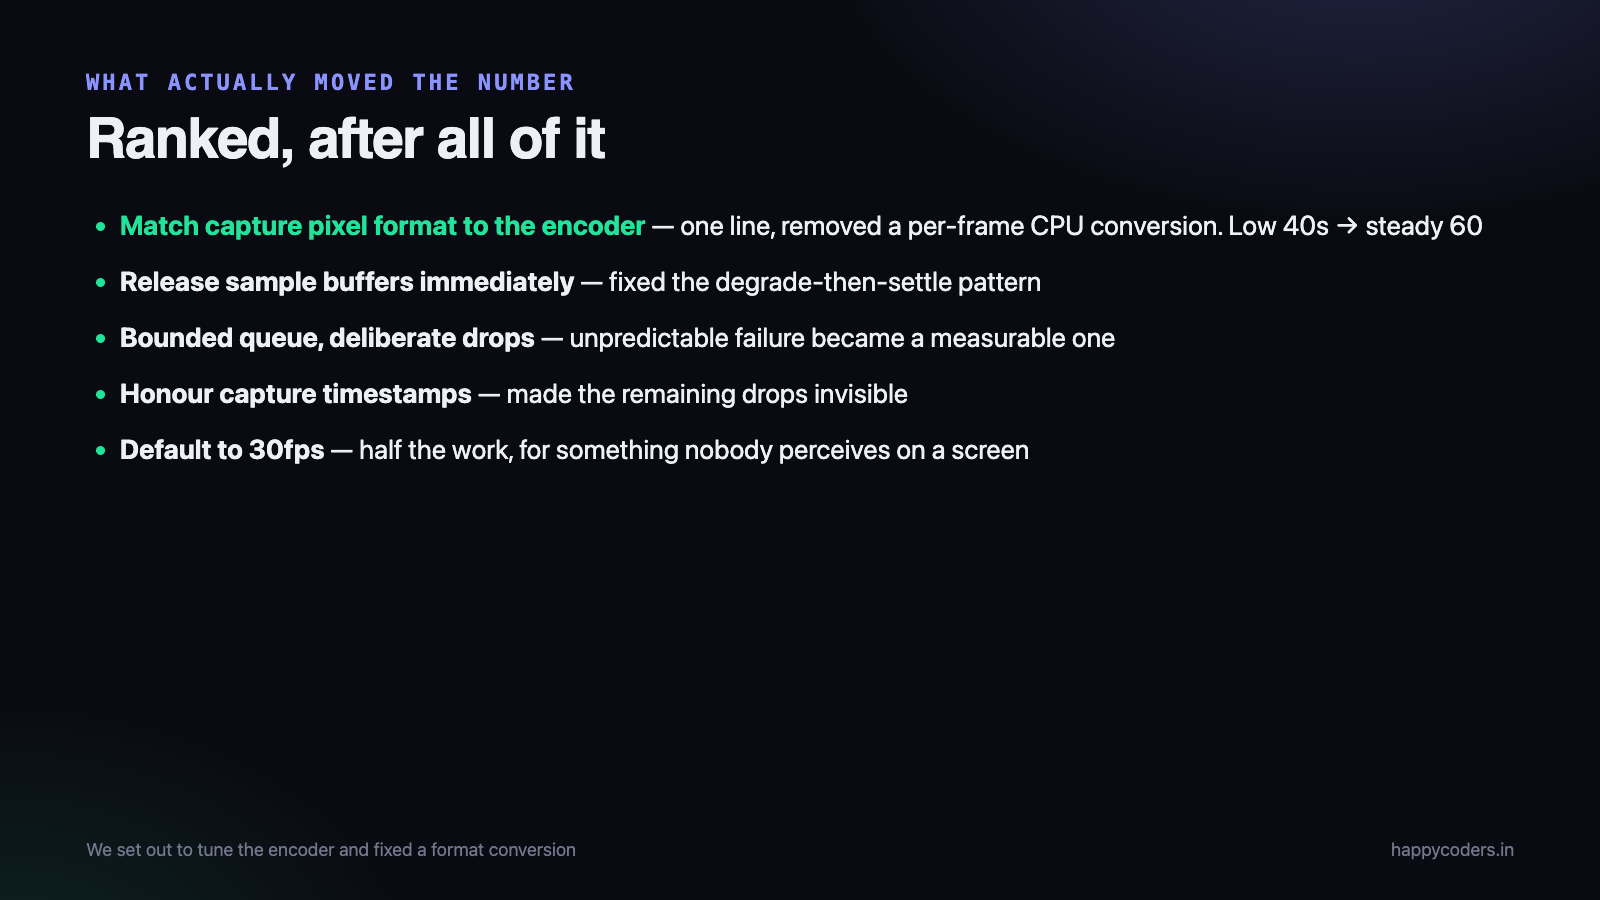
After all of it, ranked by effect on our own output:
- Matching the capture pixel format to the encoder. One line, removed an entire per-frame CPU conversion. By far the biggest change.
- Releasing sample buffers immediately. Fixed the degrade-then-settle pattern.
- A bounded queue with deliberate drops. Turned an unpredictable failure into a measurable, graceful one.
- Honouring capture timestamps. Made the remaining drops invisible to the viewer.
- Defaulting to 30fps for screen content. Halved the work for something almost nobody can perceive in a screen recording.
That last one is worth dwelling on. A great deal of engineering effort goes into hitting 60fps for content that does not benefit from it. A screen recording of somebody typing and scrolling looks identical at 30, and the pipeline has half as much to do at every stage.
Reproducing it, which is harder than fixing it
Frame drops are load-dependent, so they appear on a customer’s machine and not on the developer’s. Before any of the above was useful, we needed a way to make the problem happen on demand.
Four things that reliably provoke it, and are worth keeping as a manual test:
- Record the largest display you have at native resolution, not the laptop screen. A 4K external panel is four times the pixels of a scaled 1080p one.
- Record while something is animating constantly — a video playing, a long page being scrolled continuously. Screen content that never goes idle removes the slack the pipeline normally has.
- Load the machine. A build running, or a few browser tabs with video. The recorder does not exist alone on the user’s laptop and should not be tested as though it does.
- Record for twenty minutes, not thirty seconds. The buffer-pool exhaustion bug does not appear in a short take, which is exactly why it reached users.
We eventually built a test harness that renders a full-screen counter at 60fps and records it, then counts the distinct values present in the output file. If the counter goes 1, 2, 4, 5, 7 then frames 3 and 6 were lost, and you know precisely how many and where — which beats watching a recording and forming an impression.
What to tell the user
A recorder that silently produces a worse file than the settings promised is the thing users find hardest to forgive, because they discover it after the session they cannot repeat.
Once the counters exist, telling them becomes easy and worth doing:
- While recording, if drops exceed a few per cent for several seconds, show it — quietly, in the recorder’s own window. Not a dialog; a small indicator that the rate is below the target.
- Suggest the fix rather than stating the problem. “Recording at 4K60 on this machine is dropping frames — 1× resolution or 30fps would be steady” is actionable. “Frames dropped” is not.
- After recording, if the average fell well short, say so before the user walks away, while a re-take is still cheap.
- Never round the number up in the interface. A file that averaged 41fps should not be described as 60.
This also changes the support conversation completely. “Your recording looks stuttery” becomes a log line that names a stage, and half the reports turn out to be an external USB drive or a 4K display on a five-year-old machine — neither of which is a bug, and both of which we can now say with confidence rather than guess at.
One number worth putting in the file
A small thing that paid for itself: write the measured average frame rate into the recording’s own metadata, alongside the settings that were requested. When a file turns up in a support conversation six weeks later, the file itself says what happened rather than depending on a log nobody kept.
It also settles the most common ambiguity in these reports, which is whether the stutter is in the recording or in the playback. A file whose metadata says a steady 60 and which looks jerky is a player or a display problem, not ours — and being able to establish that in ten seconds is worth the two lines it took to record it.
The lesson that generalises
None of this was findable by reading the code. Every one of the causes was a queue filling up somewhere, and queues are invisible until you count what goes into them and what comes out.
If you are debugging a real-time pipeline of any kind — video, audio, network, jobs — the first move is not to read the code. It is to put a counter on each boundary and print them once a second. The shape of the numbers names the stage, and naming the stage is most of the work.