Why Your Reports Get Slow, and What to Do Before They Do
Why Your Reports Get Slow, and What to Do Before They Do
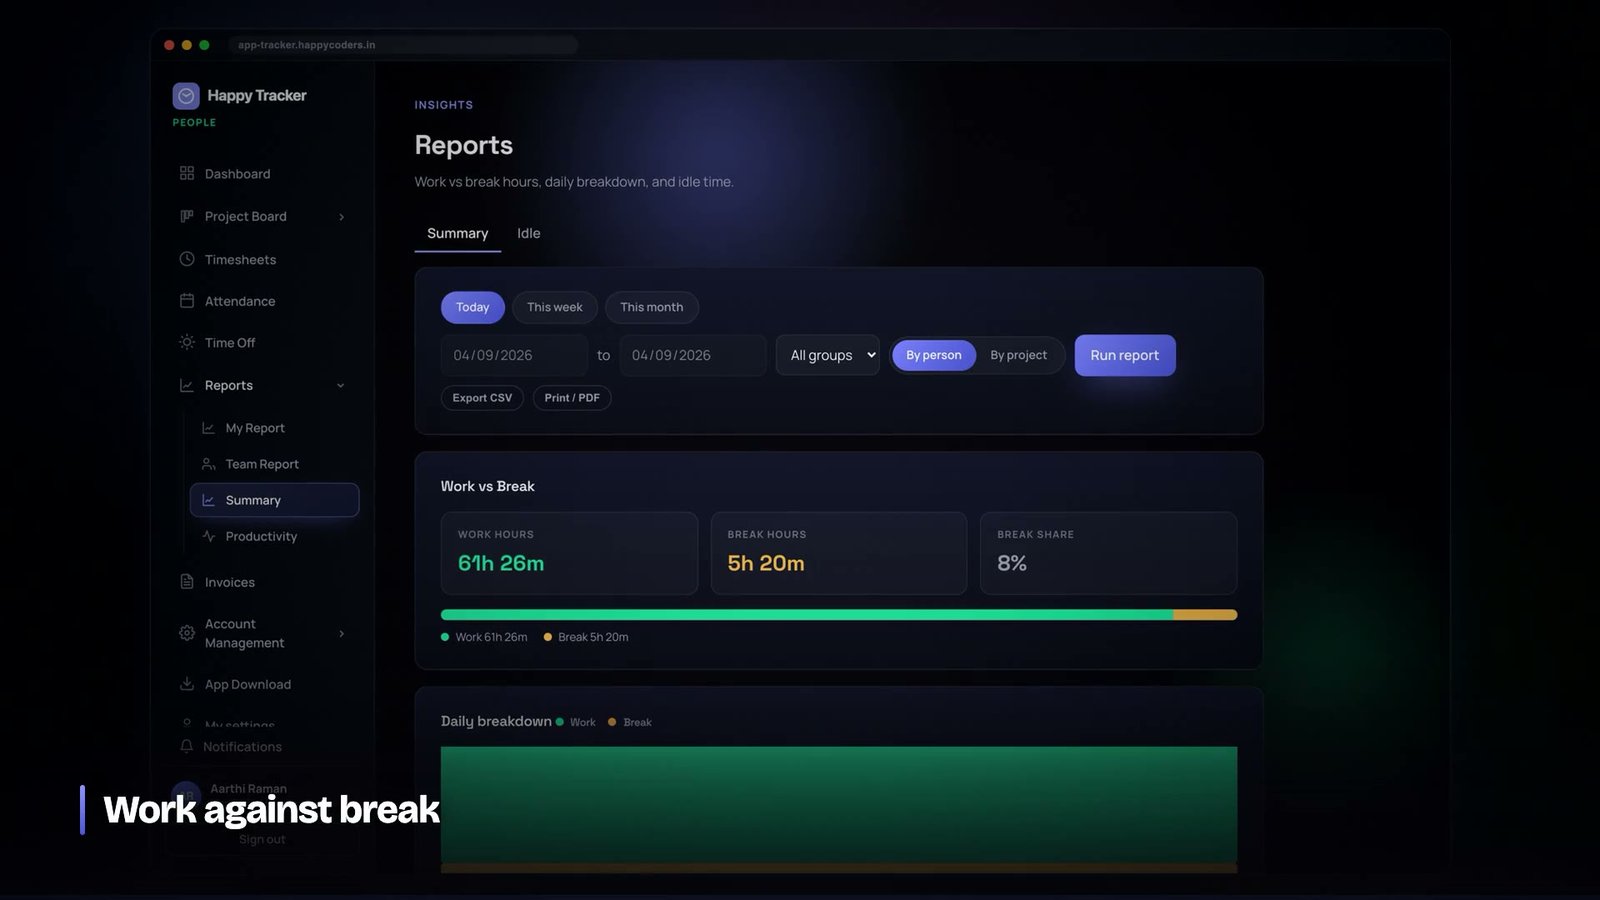
Every reporting feature is fast in development. You have four users, a hundred time entries and a week of history, and the query returns before you have let go of the mouse. Eighteen months later the same query is running against a customer with ninety people, four hundred thousand entries and two years of activity blocks, and a manager is looking at a spinner.
What follows is where the time actually goes in a time-tracking product, in the order we hit it, and which of the fixes were worth doing early rather than under pressure.
The shape of the data is the whole problem
Reporting on time tracking has an awkward property: the rows are small and there are a great many of them, and almost every question is an aggregation across a date range with several optional filters.
Three tables dominate. Time entries, which grow with people multiplied by working days multiplied by sessions per day — modest. Activity blocks, which grow with people multiplied by working hours multiplied by blocks per hour, and are an order of magnitude larger. Screenshots, which are metadata rows pointing at objects and grow fastest of all.
A company with ninety people generates a few thousand time entries a month and several hundred thousand activity blocks. Any report that touches blocks is operating on a different scale from one that only touches entries, and treating them as the same kind of query is the first mistake.
Index for the query you actually run
The single highest-value change, and the one most often made too late, is indexing on the shape of the real query rather than on the columns that feel important.
Almost every report we serve filters by organisation, then by a date range, and often by user or project. That is a composite index with the tenant column first, because it is always present and always an equality, then the date, because it is always a range, then the discriminator. An index on the date alone is nearly useless in a multi-tenant product: it narrows to every customer’s Tuesday rather than to one customer’s month.
The rule of thumb that has served us well: equality columns first, range columns last, and put the tenant column at the front of every one of them.
In a shared-database product the tenant column belongs at the front of practically every index. It is the only predicate guaranteed to be present in every query you will ever write.
The mistake we made: indexing what was displayed
Our first pass indexed the columns the reports showed — durations, statuses, the fields visible in the table. Almost none of them appeared in a WHERE clause. The indexes cost write throughput on the hottest table in the product and bought nothing at all, and the reports stayed slow.
Read the query plan before adding an index, not after. It takes ten minutes and it is the difference between a fix and a superstition.
One query per row is the classic way to lose
A report listing thirty people, each with their hours for the period, is the textbook setting for a query per person, and it is easy to write accidentally: fetch the members, then in the loop that renders them, ask for each one’s total. Thirty-one queries instead of two.
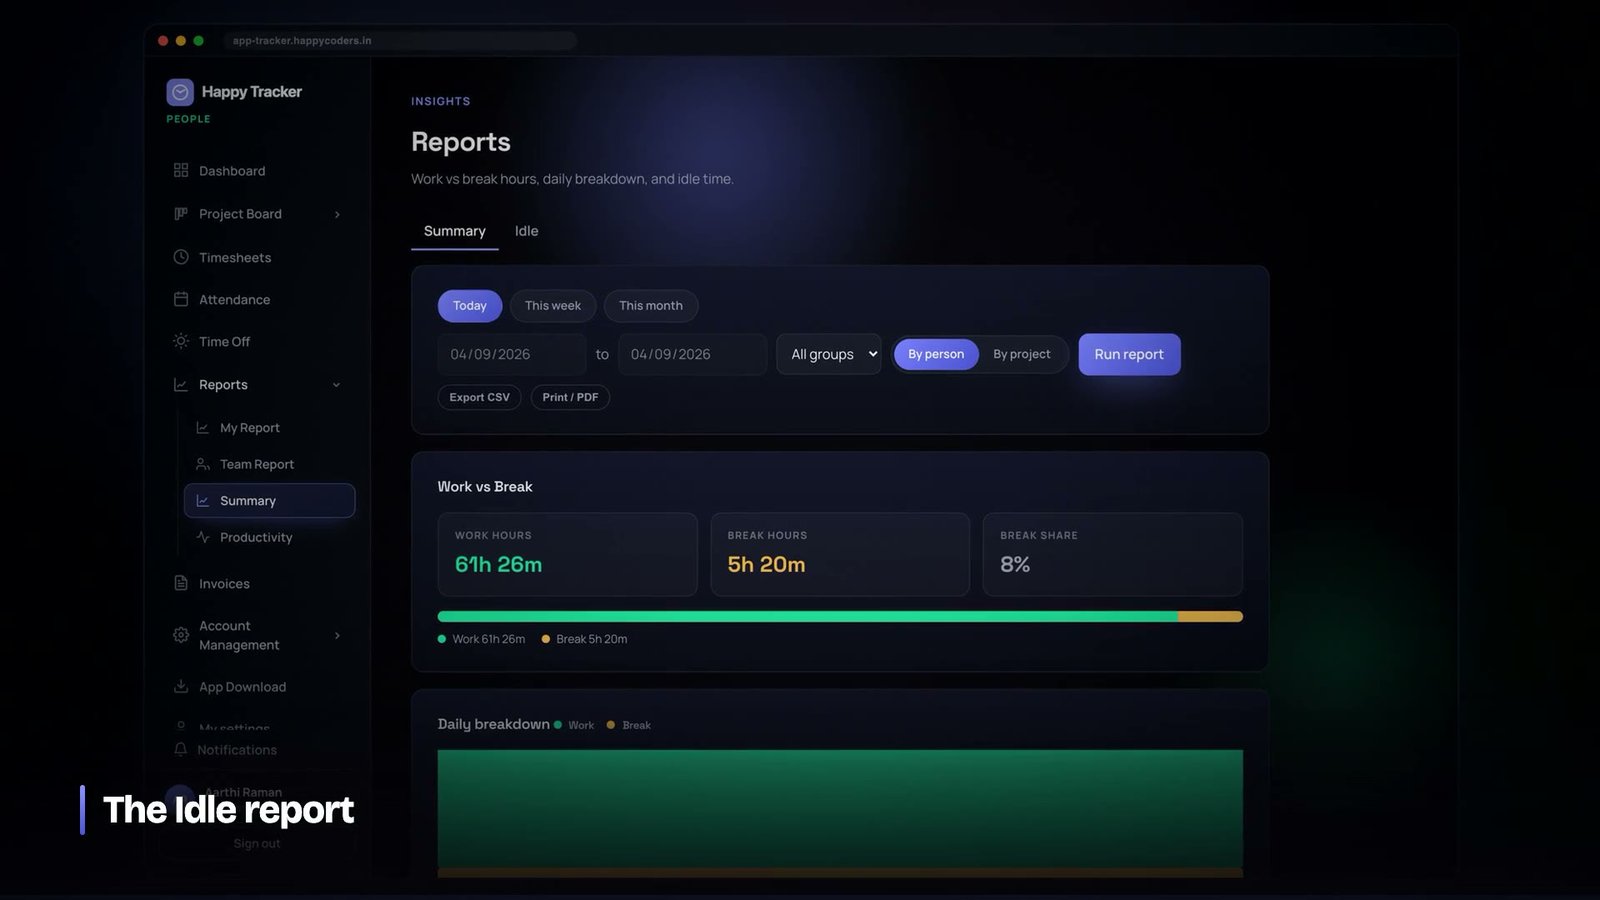
It never looks slow with three test users. It becomes the whole response time at ninety, and worse, it degrades linearly with exactly the customer you least want to disappoint — the biggest one.
The fix is to fetch the aggregate in one grouped query keyed by user, and read from that map while rendering. This is elementary and it is still, in our experience, the most common cause of a slow page in an application of this kind. It is worth a specific look during review whenever a list gets a new column, because that is when it gets reintroduced.
Compute daily series in the database, then fill the gaps in code
Charts want a value for every day in the range, including the days with nothing. The tempting approach is to iterate the dates and query each one. Thirty-one queries to draw a month.
What works better is one grouped query returning the days that have data, and then filling the missing days with zeros in application code. The database does the aggregation it is good at, and the trivial job of producing a contiguous series happens where it is cheap.
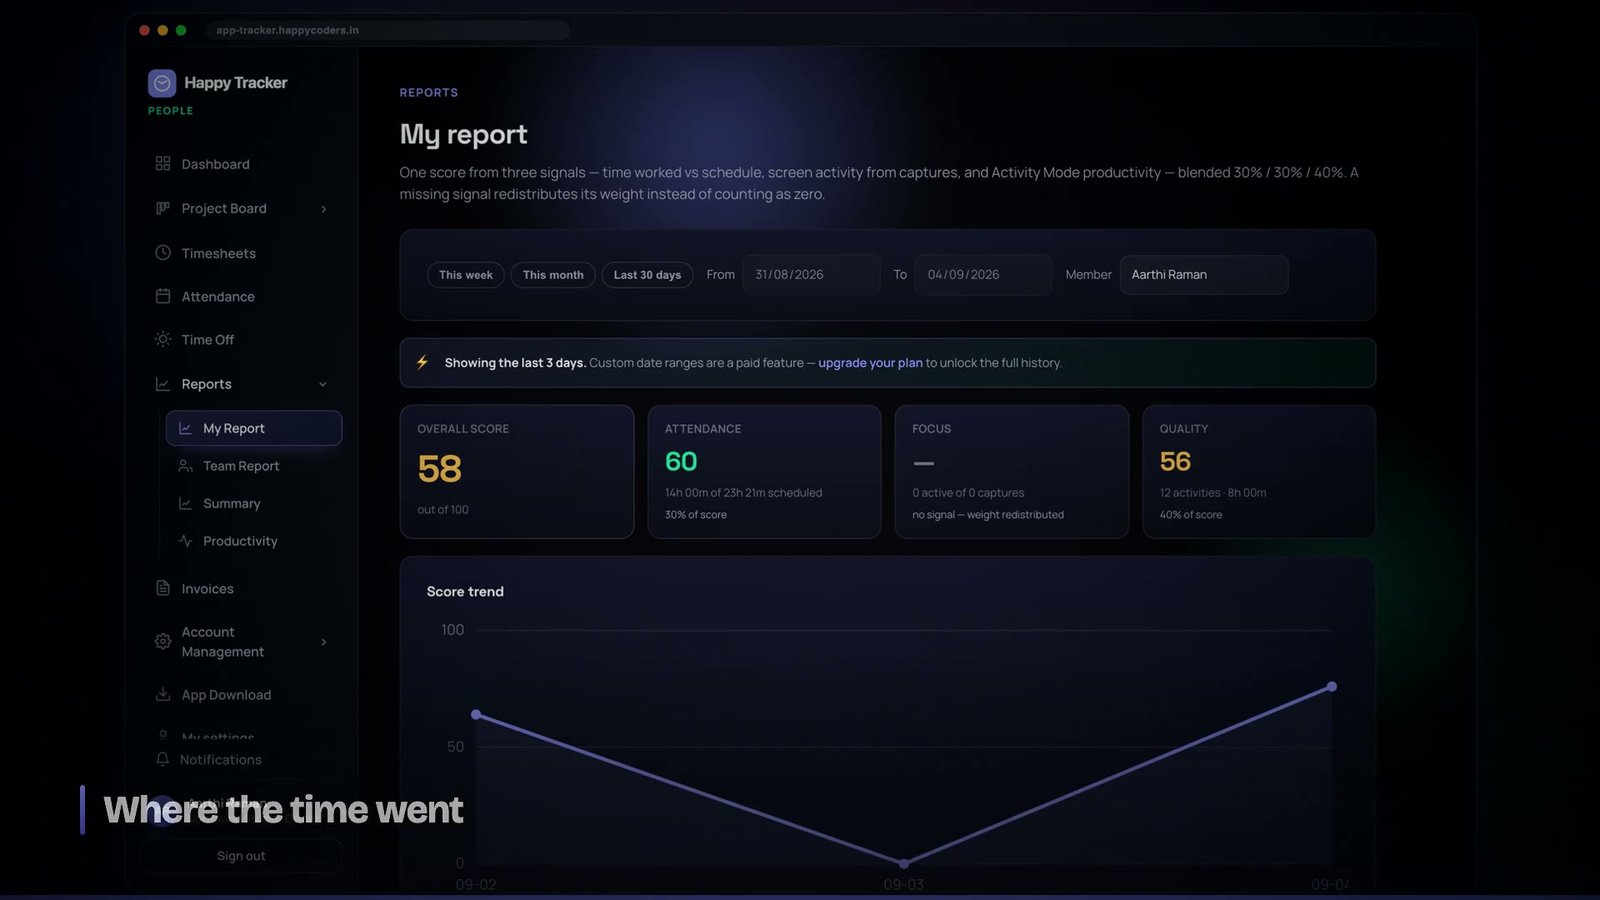
This also avoids a subtle correctness problem. If you iterate dates in the application and query each one, the boundaries are computed in the application’s timezone; if you group in the database, they are computed in the database’s. Mixing the two produces reports that are correct except for entries near midnight, which is the hardest kind of wrong to notice and the easiest kind to be embarrassed by.
Windowing by plan, which turned out to be an architectural gift
Plans in our product carry a retention window and a report window. A smaller plan keeps activity data for a few days; a larger one keeps it longer.
This started as a commercial decision and became one of the more useful technical properties of the system. The heaviest table in the product is bounded, per customer, by their plan. A scheduled job deletes activity blocks and screenshots past the window. Growth is not unbounded, index sizes stay reasonable, and the pathological case — a customer with four years of second-by-second activity — cannot occur.
If you are building something with a naturally unbounded event table, consider bounding it deliberately even if you have no commercial reason to. The alternative is discovering the ceiling when a customer reaches it, which is always at the worst time.
The rule that keeps this safe is that the pruner touches only derived, high-volume data. It never touches time entries, projects, tasks or invoices, because those are business records and a storage policy must never be able to delete billing history.
Export is a different problem from display
A page shows fifty rows. An export contains everything, and the two should not share an implementation.
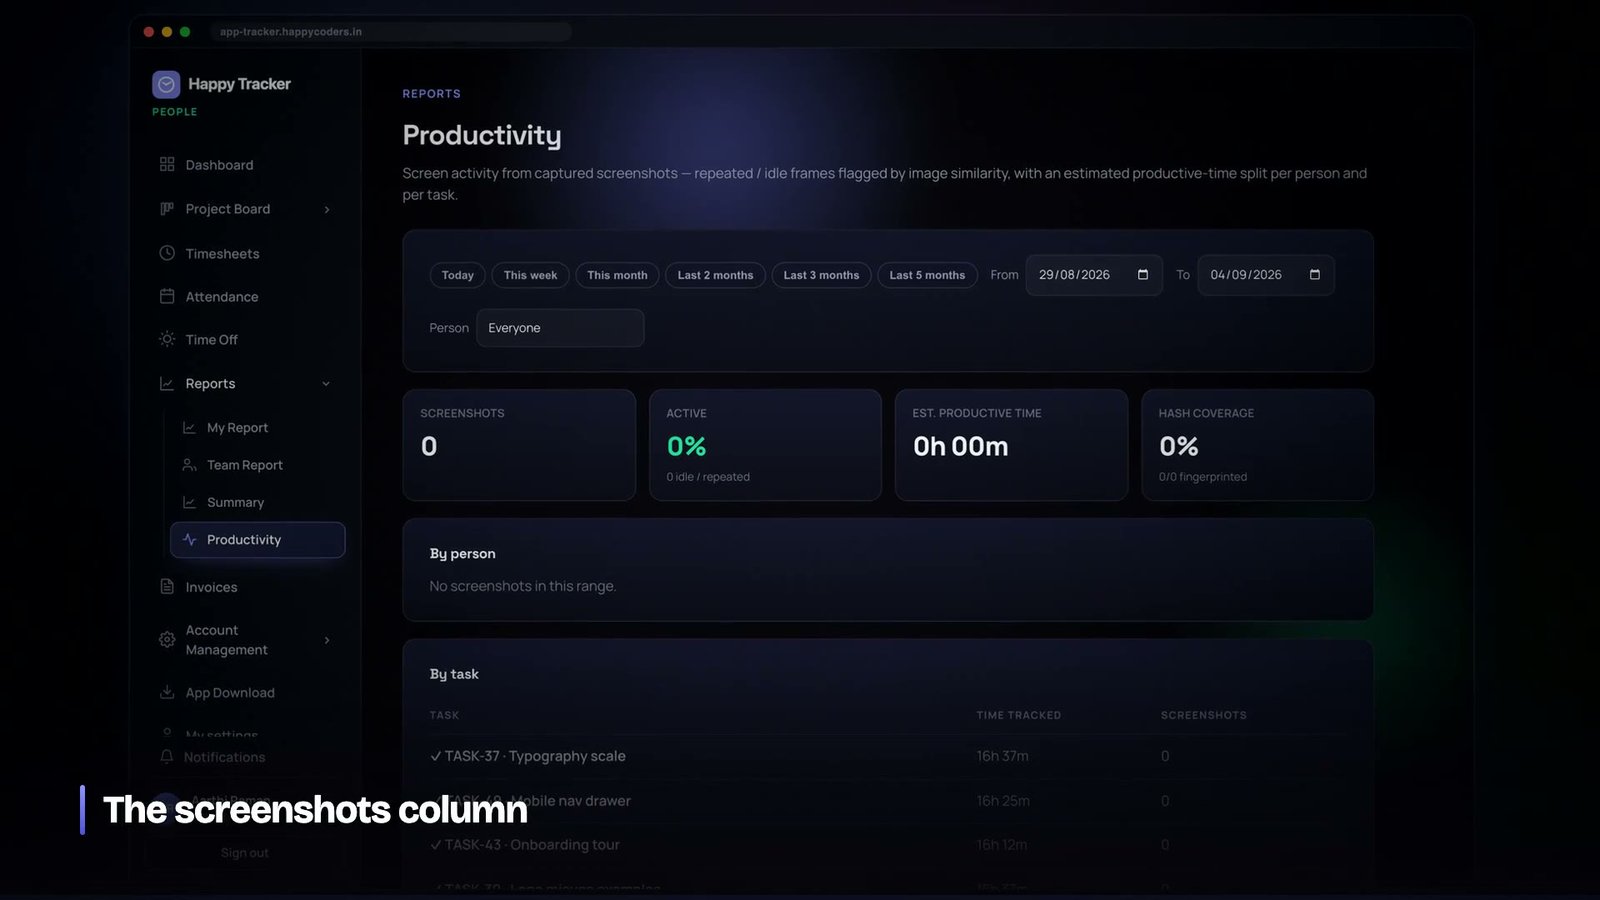
Loading a full result set into memory to build a file works until somebody exports a year for the whole company, and then it fails in the least helpful way possible — a request that consumed a lot of memory and returned an error. Streaming rows as they are read keeps memory flat regardless of size.
It is also worth accepting that a report and its export can legitimately differ. The screen shows what fits and what is useful; the export can carry the underlying detail. Trying to make them identical usually means either an over-detailed screen or an under-detailed file.
The optimisations we deliberately have not done
Two things we keep being tempted by and keep deciding against, at least for now.
Materialised daily totals. A table of per-user, per-day, per-project sums would make every report instant. It would also introduce the one thing this product has so far avoided: a second copy of a number that has to be kept in step with the first. Every backdated correction, every administrator edit, every automatic clock-out becomes an invalidation problem. We will do this when the read cost genuinely justifies it, and not before, because the class of bug it introduces — a total that is subtly wrong and cannot be traced to any single event — is exactly the kind this product exists to eliminate.
Caching report responses. Attractive until you consider that the most common reason to reload a report is that somebody just corrected an entry and wants to see the effect. A cache that has to be invalidated by every write, on a page whose entire purpose is to reflect recent writes, buys very little.
Before caching an expensive read, check whether the reason people reload it is precisely that something changed. If so, you are about to build an invalidation problem in exchange for very little.
Filters change the plan, and the empty filter is the dangerous one
Reports in a product like this carry a row of optional filters: a team, a person, a project, a date range, sometimes a status. In development they are mostly used. In production the most common request is the one with every filter empty, because that is what the page loads with.
This matters because an empty filter is not a cheaper query, it is the most expensive one you will ever run, and it is the one you have tested least. It is worth deliberately benchmarking the no-filter case on realistic data volumes, since it is simultaneously the default and the worst case.
A related trap is building the query by conditionally appending clauses. It reads well and it quietly produces very different plans depending on which filters are present — some fast, some not — and the slow combinations are discovered by customers. Where a filter changes the shape of the work substantially rather than just narrowing it, we would rather have two clear queries than one clever one whose performance depends on which boxes were ticked.
Timezones are a correctness problem wearing a performance costume
Every organisation in our product has a timezone, because a working day is a local concept and a report that says “Tuesday” has to mean Tuesday where the team is.
Timestamps are stored in UTC, which is the only sane choice. Every boundary — the start of a day, a week, a month, a sprint — is computed in the organisation’s timezone and then converted before it reaches the database. The conversion happens in exactly one place, and everything that needs a range asks that place for it.
Two failures we have seen. The first is computing the range in one timezone and grouping in another, which produces reports that are correct except for entries within a few hours of midnight. The second is arithmetic that assumes a day is twenty-four hours, which is true except across a daylight-saving change; in a region without DST you can go years before this bites, and then a customer in another region signs up.
The performance connection is that people frequently fix these by pulling rows into the application and grouping there, because it feels more controllable. That converts a correctness bug into a correctness bug that is also slow. Fix the boundary calculation and let the database group.
Numbers that must agree
A report is only as valuable as the trust people place in it, and trust is destroyed by two pages that disagree. A dashboard that says thirty-eight hours and a report that says thirty-nine for the same week is a support ticket and, worse, a reason to stop believing both.
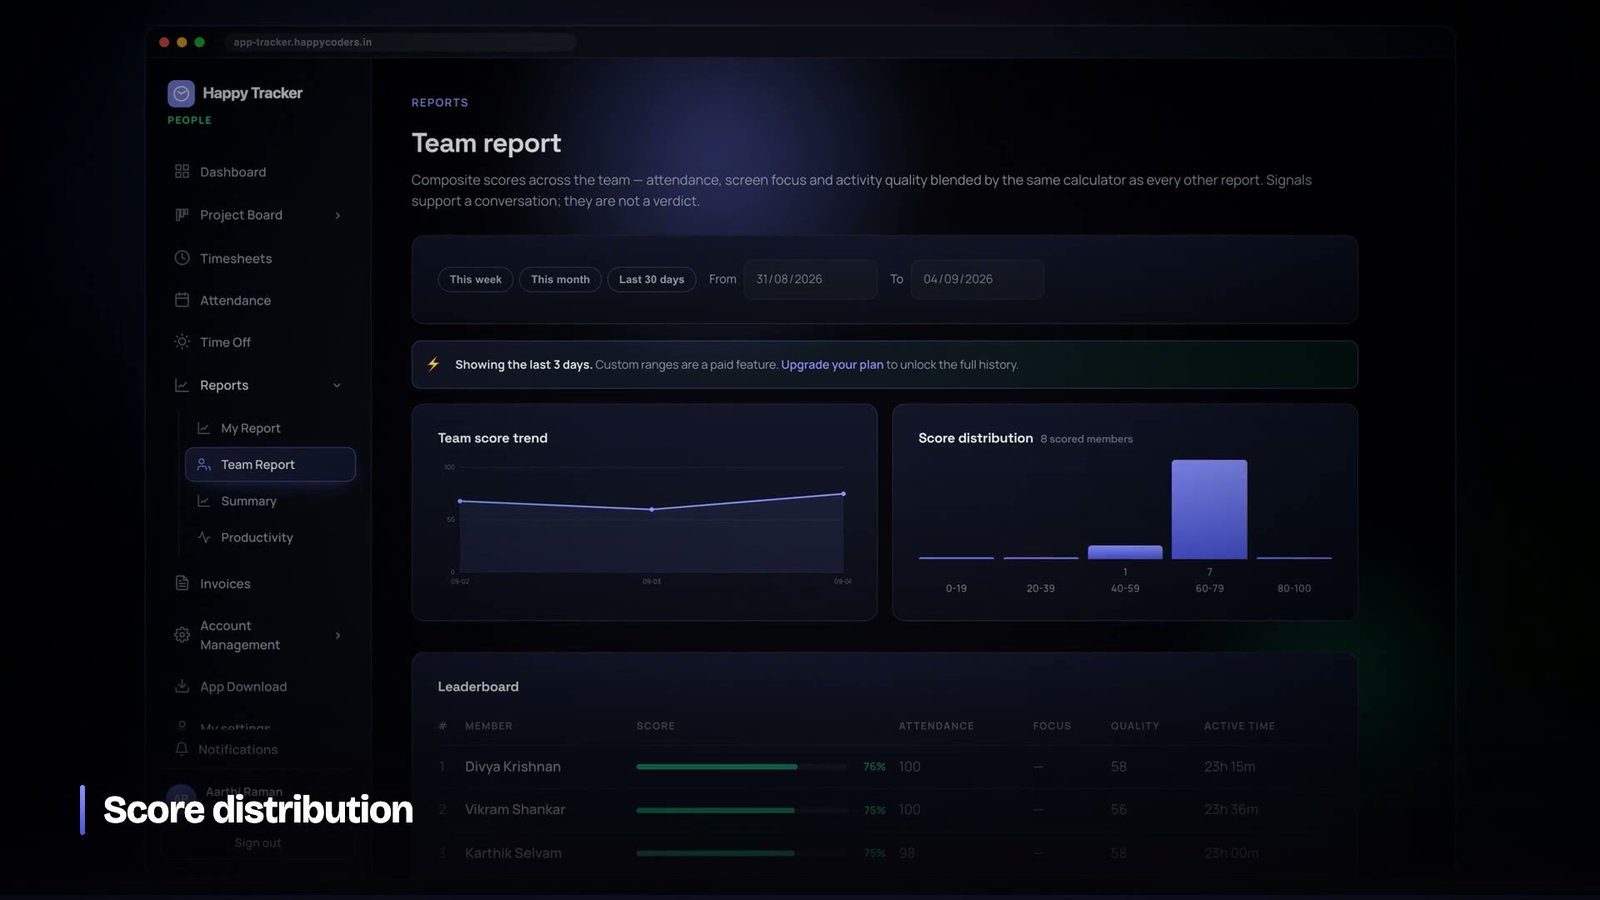
Disagreements come from a small number of causes, and all of them are avoidable. Break time included in one place and not another. A different rounding rule. One view filtering to a status the other does not. A timezone boundary computed twice.
Our defence is that there is one scope for “work” — entries of kind work — and every total in the product applies it, from the personal dashboard to the invoice generator. Break time is recorded fully and excluded consistently. When we added invoicing we did not write new aggregation; we reused the same scope, because a billing number that disagrees with the timesheet it came from is not a discrepancy, it is a dispute.
A cheap habit that has caught several of these: a test that computes the same figure through two different code paths and asserts they match. It fails the moment somebody adds a rule to one path and not the other, which is precisely the change that would otherwise ship unnoticed.
Read the plan, not the stopwatch
When a report is slow the instinct is to time it, change something, and time it again. That works and it is slow to converge, because a response time bundles together query time, serialisation, network and rendering.
Reading the query plan tells you which of those it actually is in about a minute. Most of the time the answer is a full scan where you expected an index seek, or a temporary table where you expected a sort — and both are visible immediately rather than inferred from a stopwatch.
It is also the only way to catch the case where the index exists and is not being used, which happens more than people expect: a function applied to an indexed column, a type mismatch between a parameter and the column, an OR that defeats the composite. In all three the index is present, the developer is confident it is being used, and it is not.
The habit worth building is to look at the plan when you add the index, not when a customer complains. At that moment you know exactly what you intended the query to do, and it costs nothing to confirm that the database agrees with you.
Pagination is a correctness feature, not a convenience
Any list that can grow needs pagination, and the reason is not that long pages are slow. It is that an unpaginated endpoint has no upper bound on what a single request can cost, and the request that discovers the bound will be made by your largest customer at the worst moment.
The subtlety is ordering. Paginating by offset over rows ordered by a non-unique column produces duplicates and omissions between pages, because rows with equal values can come back in a different order each time. A report sorted by date, paginated by offset, will show the same entry on page two and page three and silently drop another. Nobody reports this as a bug; they report that the numbers do not add up, which is much harder to diagnose.
Ordering by a unique tiebreaker as well as the visible sort column fixes it entirely and costs nothing. It is one of those changes that prevents a class of bug so quietly that you never find out how much time it saved.
Counting is its own query
Showing a total alongside a page means a second query, and on a large filtered set the count can cost more than the page itself. It is worth asking whether the exact total is needed at all — most of the time people want to know roughly how much there is and whether there is more, and both of those can be answered without a full count.
Where the exact number genuinely matters, run it as a separate request so the page renders immediately and the total arrives when it arrives. A page that waits on a count nobody is reading is a page that feels slow for no benefit.
Measure the query, not the feeling
A last habit that has saved us more time than any single optimisation: when somebody says a page is slow, get a number before changing anything. Which query, how long, how many rows examined against how many returned. That last ratio is the most informative single figure in database performance, and it is almost never what people expect.
A query that examines four hundred thousand rows to return thirty is an index problem, whatever else is happening on the page. A query that examines thirty-one to return thirty is fine and the time is going somewhere else entirely — serialisation, a chart library, an image. Guessing which of those it is wastes an afternoon; looking takes a minute.
What we would tell anyone building this
- Index the query, not the display. Read the plan first.
- Tenant column at the front of every composite index.
- Never query inside a render loop. One grouped query, then a map.
- Aggregate in the database, fill gaps in code, and keep every date boundary in one timezone.
- Bound your highest-volume table on purpose. Retention is a performance feature.
- Never let the pruner touch business records.
- Stream exports. Somebody will ask for a year of the whole company.
- Resist materialised totals until the read cost forces it, then treat the invalidation path as the real feature.
Almost none of this is clever. It is a handful of ordinary decisions taken early, when they are cheap, rather than under pressure with a customer waiting — which is the only real difference between a reporting layer that scales and one that has to be rewritten.
Happy Tracker’s reports run on exactly these principles and the whole product is free for up to five users, no time limit and no card, at happytracker.happycoders.in.