Memory and Disk Pressure in a Three-Hour Recording
Memory and Disk Pressure in a Three-Hour Recording
Our recorder was fine. Every test recording was two to five minutes, every one of them was perfect, and we had tested on four machines. Then a training company recorded a three-hour workshop with HappyRec, and the process was killed at two hours and fourteen minutes with 11 GB of resident memory and a file nobody could open.
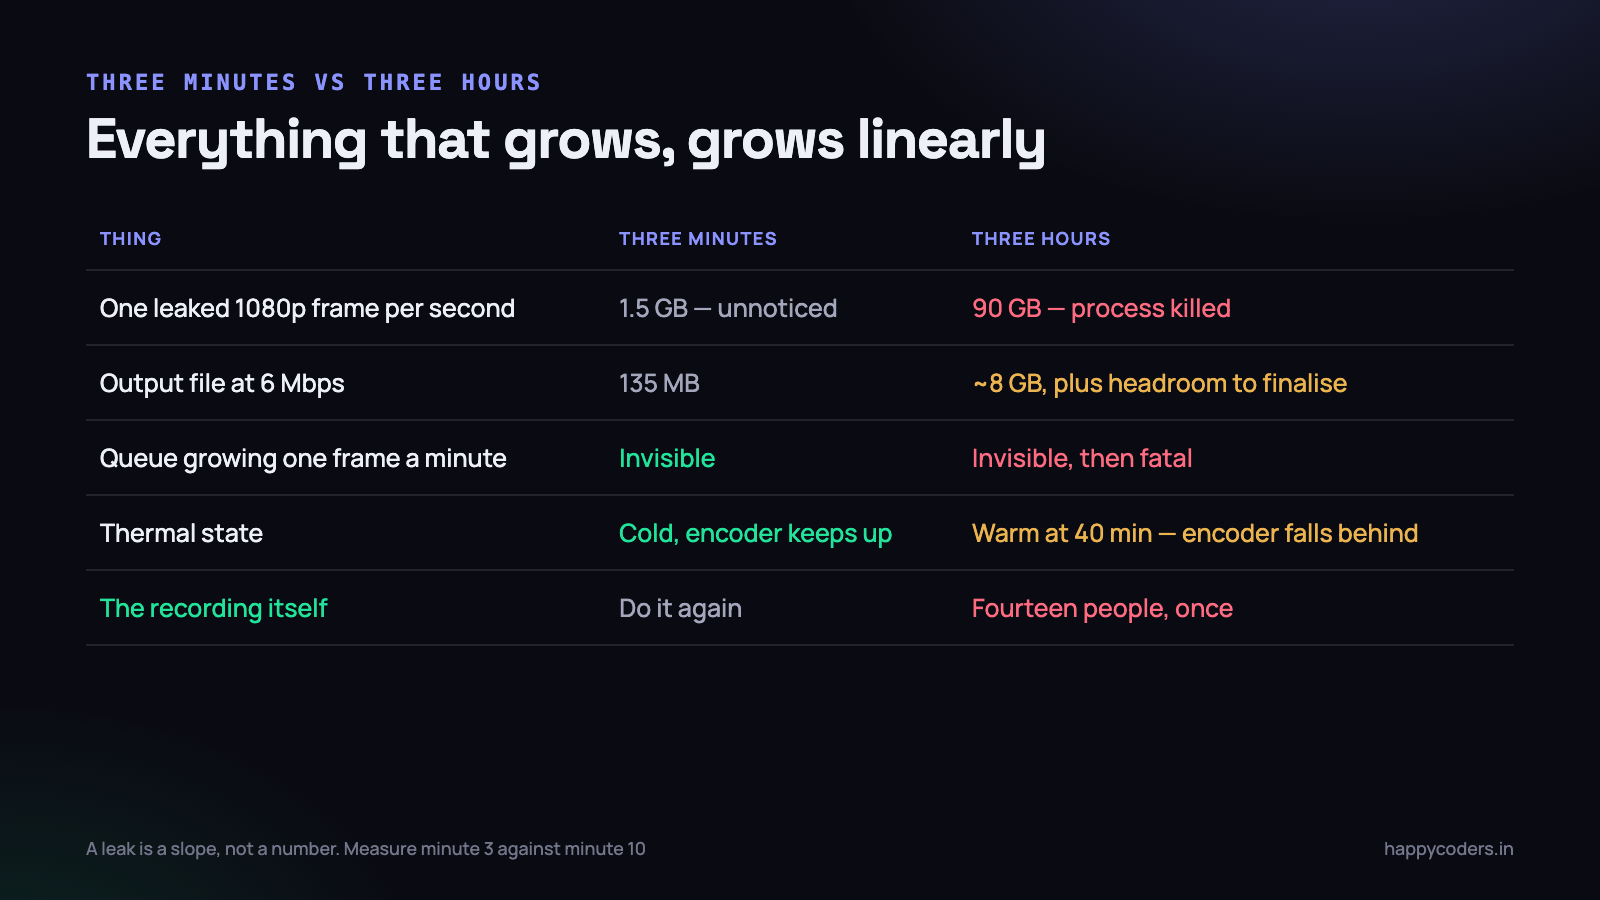
Nothing about the code was wrong in the way a bug is wrong. The pipeline behaved identically at minute one and minute one hundred and thirty. That is exactly the problem: a small, constant leak and a small, constant queue growth are invisible in a three-minute recording and fatal in a three-hour one.
Long recordings are a different engineering problem, and they need to be designed for rather than discovered.
Why three hours is not sixty times three minutes
Everything in a capture pipeline that grows, grows linearly with time, and the numbers get large quickly. It is worth doing the arithmetic once, because it reframes what counts as a small mistake.
A single 1080p frame in BGRA is 1920 × 1080 × 4, which is 8.3 MB. Leak one frame per second — one — and you are leaking 30 GB an hour. In a three-minute test that is 1.5 GB, which on a 32 GB machine you may not even notice. Over three hours it is the whole machine.
The output file has the same shape. 1080p30 at a sensible bitrate for screen content is roughly 6 Mbps, which is 2.7 GB an hour, or about 8 GB for the workshop. Add a faststart rearrange at the end that needs comparable free space while it runs, and a MacBook with 15 GB free at the start is not going to finish.
- A leak is a slope, not a number. 400 MB after three minutes tells you nothing. 400 MB after three minutes and 900 MB after eight tells you everything.
- A queue that grows by one frame a minute is imperceptible for an hour and then is not.
- Thermal behaviour changes mid-recording. After thirty to forty minutes the machine is warm, clocks drop, and the encoder that comfortably kept up now does not. Bugs that only appear after forty minutes are usually this.
- The user cannot re-take it. A three-hour workshop happened once, with fourteen people in the room. This is the single most important difference, and it is not technical.
Pixel buffer pools, and holding a frame too long
ScreenCaptureKit does not allocate a fresh buffer for every frame. It works from a pool of IOSurface-backed pixel buffers and recycles them. When a frame is delivered to your callback and you return, the buffer goes back to the pool and is used again a few frames later.
If you retain the buffer — because you queued the CMSampleBuffer for the encoder, or kept a reference for a live preview, or put it in an array to do something clever with later — it cannot be recycled. The pool empties, and the system either starts dropping frames or allocates more memory, depending on how the pool was configured and how much of it you are holding.
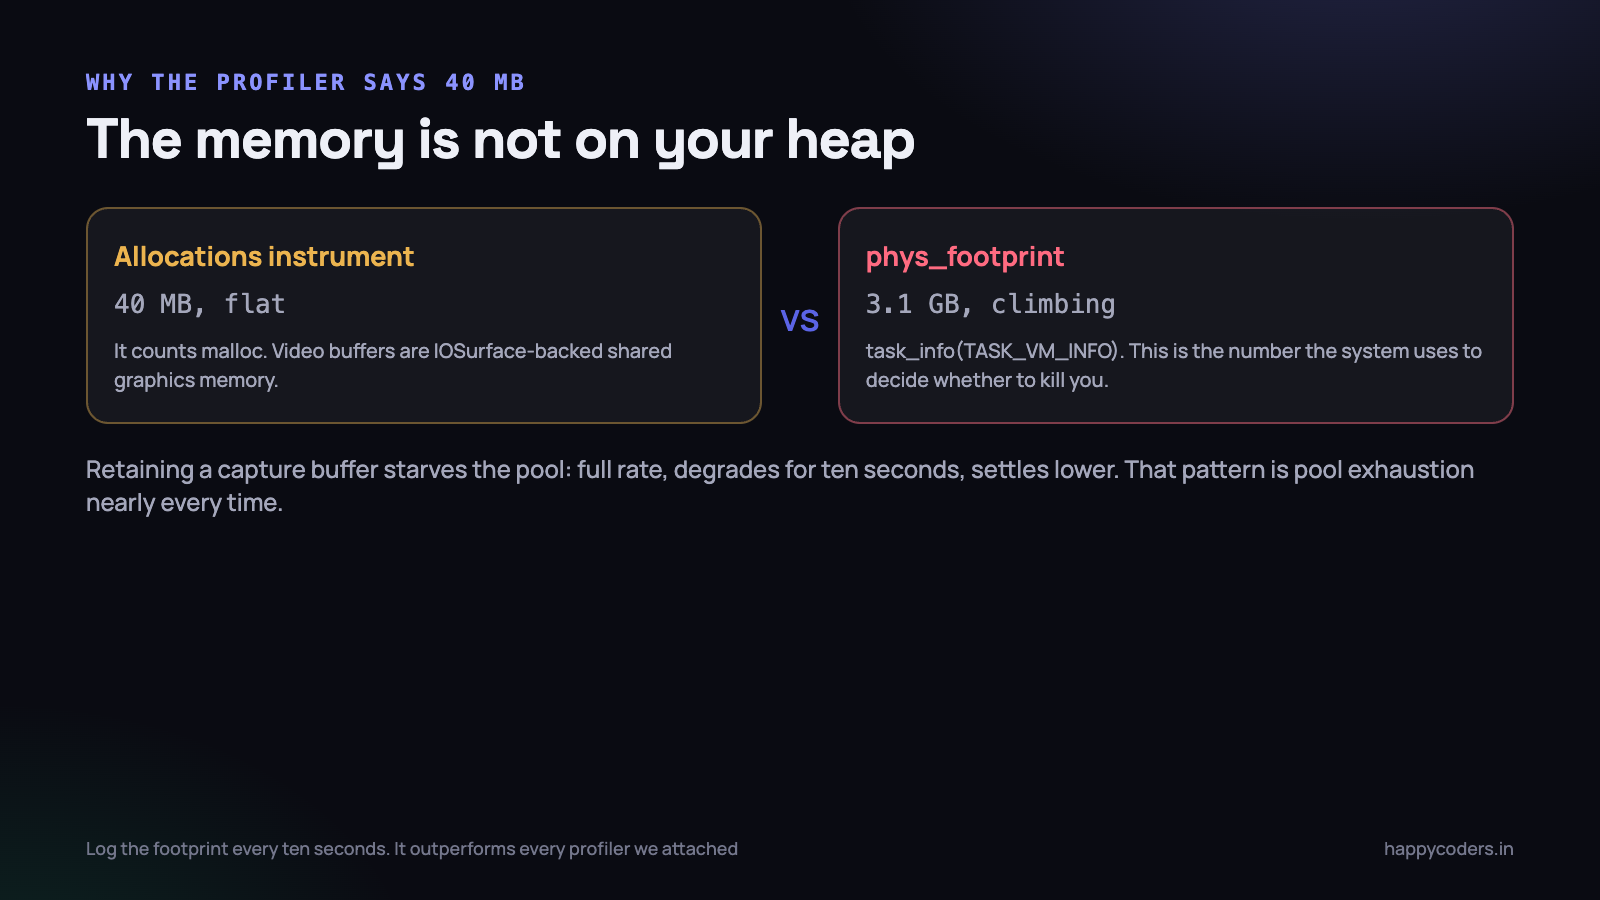
This has a very distinctive signature and it is worth learning to recognise, because it saves days. Recording starts at the full frame rate, degrades over the first ten or fifteen seconds, and then stabilises at a lower rate and stays there. That pattern is pool exhaustion almost every time. A CPU limit looks different: it tracks machine load rather than settling.
The rule that fixed it for us is blunt and has no exceptions. Nothing leaves the capture callback holding a capture buffer. Either the consumer takes it and is genuinely faster than the producer, so nothing accumulates, or you copy what you need into a buffer from your own pool and let the original go immediately.
func stream(_ stream: SCStream,
            didOutputSampleBuffer sb: CMSampleBuffer,
            of type: SCStreamOutputType) {
    autoreleasepool {
        guard type == .screen,
              let src = CMSampleBufferGetImageBuffer(sb) else { return }

        // our own pool, fixed size, created once at session start
        var dst: CVPixelBuffer?
        let r = CVPixelBufferPoolCreatePixelBufferWithAuxAttributes(
            kCFAllocatorDefault, pool, poolAuxAttributes, &dst)

        guard r == kCVReturnSuccess, let dst else {
            // threshold hit: the pool is at its limit.
            // Drop this frame. Do not wait for one.
            stats.droppedByUs(); return
        }

        scaler.transfer(from: src, to: dst)       // GPU, returns fast
        encoder.submit(dst, at: CMSampleBufferGetPresentationTimeStamp(sb))
    }
    // sb is released here, every time, regardless of path
}
The aux attributes in that call are the part worth copying. Setting kCVPixelBufferPoolAllocationThresholdKey caps how many buffers the pool will ever hand out, and once the cap is reached the create call returns kCVReturnWouldExceedAllocationThreshold instead of allocating. That turns an unbounded memory growth into an explicit, countable drop at a place in the code where you can log it.
Unbounded growth is never the safe option. A bound you chose produces a dropped frame; no bound produces a killed process at minute 134.
The autoreleasepool that is not optional
Swift uses ARC, so the usual advice is that autorelease pools are a thing you no longer think about. In a capture callback that is wrong, and the reason is specific.
Core Media and Core Video are C APIs bridged into Swift, and a good deal of what you touch in that callback — sample attachment arrays, format descriptions, dictionaries of attributes — comes back autoreleased. On a dispatch queue the pool drains when the work item completes, which is usually fine. But callbacks delivered in a burst, or a serial queue processing several frames inside one item, or any tight loop over frames, will accumulate them.
At 60 frames a second the accumulation is real. We measured a sawtooth of roughly 300 MB before the pool drained, on a pipeline that had no leak at all. Wrapping the callback body in autoreleasepool removed it entirely and cost nothing measurable.
The same applies anywhere you process frames in a loop rather than one per callback — a test harness feeding synthetic frames, an export, a thumbnail pass over a finished file. If the loop touches Core Media objects, it needs a pool inside it, not around it.
Watching memory that Instruments will not show you
Here is the trap that cost us most of a day. We attached the Allocations instrument, recorded for ten minutes, and it showed a flat 40 MB. Activity Monitor showed the process at 3.1 GB.
Both were telling the truth. IOSurface-backed pixel buffers are not allocated on your heap — they are shared graphics memory, attributed to the process footprint but invisible to heap allocation tracking. Every video buffer in the pipeline lives there. A tool that only counts malloc is going to report a pipeline made almost entirely of video buffers as using no memory at all.
What you want is the physical footprint, which is what the system actually uses to decide whether to kill you.
func footprintBytes() -> UInt64 {
    var info = task_vm_info_data_t()
    var count = mach_msg_type_number_t(
        MemoryLayout<task_vm_info_data_t>.size / MemoryLayout<natural_t>.size)

    let kr = withUnsafeMutablePointer(to: &info) {
        $0.withMemoryRebound(to: integer_t.self, capacity: Int(count)) {
            task_info(mach_task_self_, task_flavor_t(TASK_VM_INFO), $0, &count)
        }
    }
    return kr == KERN_SUCCESS ? info.phys_footprint : 0
}
We log that once every ten seconds while recording, alongside the frame counters. It costs nothing, it goes into the support log, and it turns “the app got slow and then quit” into a line of numbers with a slope you can read in one glance. That one function has diagnosed more long-recording reports than every other tool we have.
Back-pressure, and why dropping beats queueing
The encoder has an input queue and it is not infinitely fast. At 4K on a warm laptop that is also running the application being demonstrated, it is entirely possible to produce frames faster than they can be consumed — not constantly, but in bursts when the screen changes a lot.
When that happens there are three possible behaviours, and only one of them survives three hours:
- Block the producer. Never in a capture callback. It converts an encoder problem into a capture problem, and now the system drops frames instead of you, without telling you which or how many.
- Queue whatever arrives. Memory grows for as long as the burst lasts. Over three hours the bursts add up, and the process is killed with the recording unfinished. This is what killed the workshop.
- Bound the queue and drop deliberately. When the queue is full, discard a frame and increment a counter. Memory is capped by construction and the loss is measurable.
The third is the only defensible answer, and the reasoning is worth stating plainly: a recording at 27 fps that exists is better than a recording at 30 fps that does not. The user cannot re-take the workshop. They can live with a moment of slightly less smooth motion during a scroll, and in practice they will never notice it. We went through this in more detail in the piece on where frames actually get dropped; the long-recording angle simply makes the choice less debatable.
What matters is that the drop belongs to you. Your frame keeps its capture timestamp, so a dropped frame becomes a frame held very slightly longer rather than a timeline that drifts away from the audio. A drop the system makes for you does not come with that guarantee.
Disk space, and stopping while the file is still good
Memory kills the process. Disk kills the file, and it does it in the most expensive way available: at the end, when the writer needs to finalise and cannot.
Two checks, both cheap, and both of which we should have had from the first version.
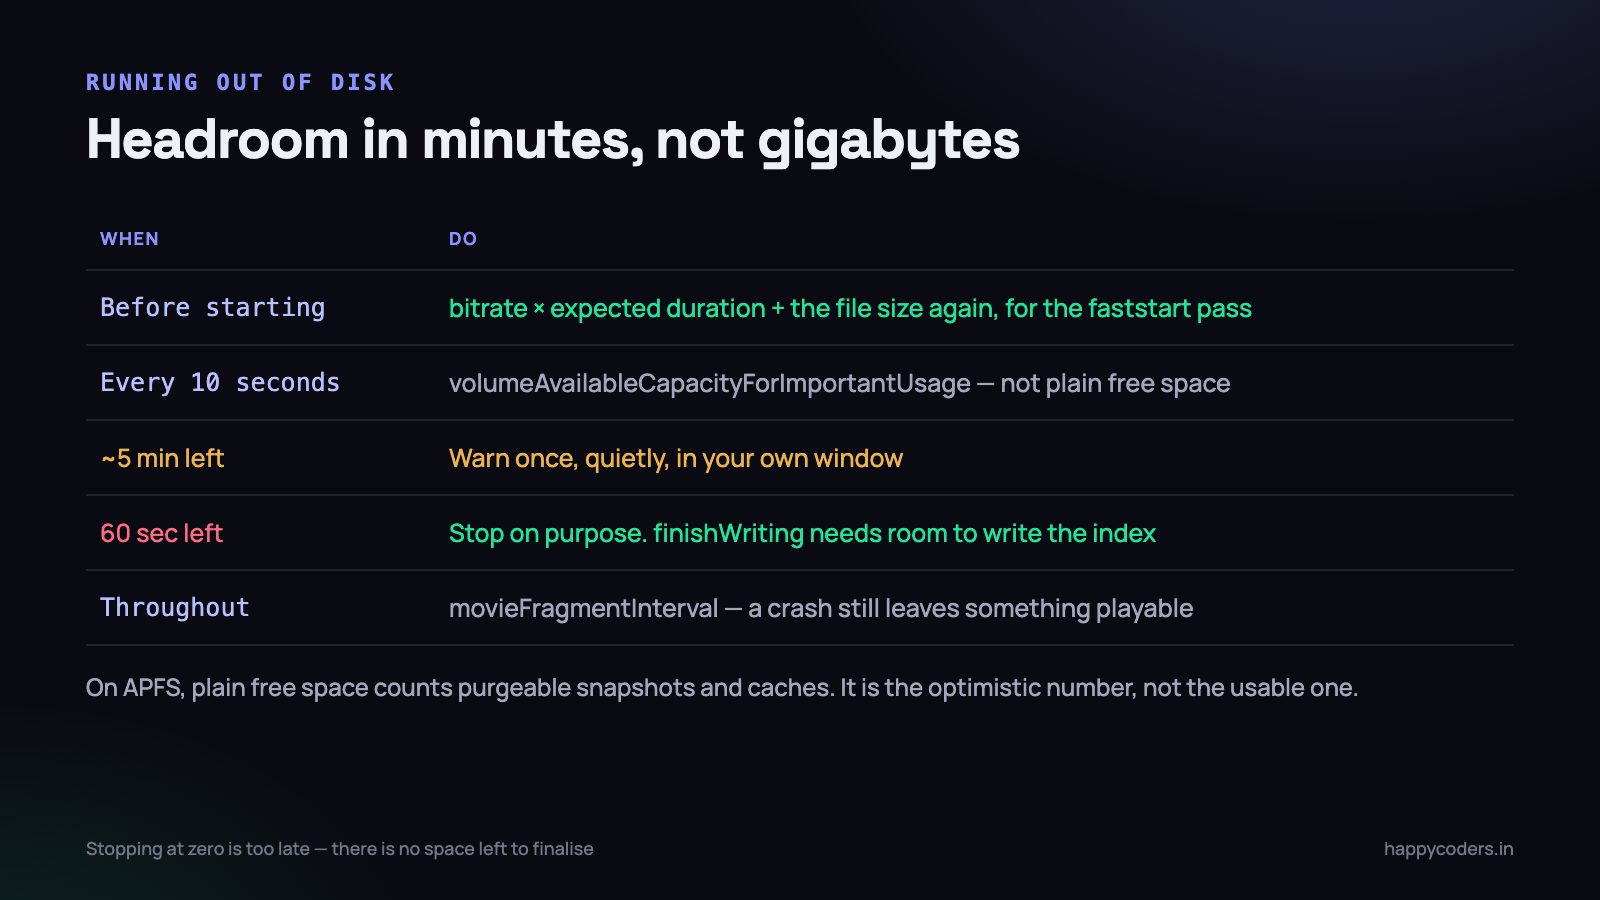
Before recording starts, estimate and compare. You know the bitrate and you can ask the user, or assume, a duration. At 6 Mbps an hour is 2.7 GB, so a three-hour session needs around 8 GB plus headroom for the finalisation pass. If the volume does not have it, say so before the user starts talking, not after.
let keys: Set<URLResourceKey> = [
    .volumeAvailableCapacityForImportantUsageKey
]
let vals = try outputURL.resourceValues(forKeys: keys)
let freeBytes = vals.volumeAvailableCapacityForImportantUsage ?? 0

// APFS reports purgeable space too; this key is the honest one
let needed = Int64(bitrateBytesPerSecond) * expectedSeconds
             + finalisationHeadroom      // ~ file size again
Use volumeAvailableCapacityForImportantUsage rather than the older free-space key. On APFS, plain free space includes purgeable content — local snapshots, cached files — which is space the system will hand over when pressed, and the number is far more optimistic than what you can rely on second by second.
During recording, check every ten seconds. Not every frame: it is a filesystem call and it does not need to happen thirty times a second. When free space falls below a threshold expressed in seconds of recording rather than gigabytes — sixty seconds of headroom at the current bitrate is a reasonable line — stop cleanly, on purpose, and finish the file.
- Warn once at roughly five minutes of remaining headroom. Quietly, in the recorder’s own window. The user may be able to free space, or may want to wrap up.
- Stop at sixty seconds of headroom, not at zero. You need room to write the index and, if faststart is on, to rearrange the file.
- Finish the writer and wait for the completion handler. This is the step that makes the file playable, and it is the one people skip in an emergency path.
- Tell the user exactly what happened and where the file is. “The disk was nearly full, so recording stopped at 2:47:10. The file is saved and complete.”
Consider fragmented writing as well. Setting movieFragmentInterval on the writer makes it flush periodic fragments, so a recording interrupted by a crash, a power loss or a forced quit is still largely recoverable. It costs a small amount of size and some compatibility with older editing software, and for a three-hour session it is usually a trade worth making.
What a three-hour recording needs in the interface
The engineering above buys you a recorder that survives. It does not, on its own, buy you a user who trusts it, and after two hours of a workshop the thing people want to know is whether it is still working.
Four pieces of information, none of which need a dialog box:
- Elapsed time and current file size, together. A size that is still growing is the most reassuring signal a recorder can give, and it costs one file-attributes call a second.
- Remaining disk, in minutes. “About 46 minutes of space left” is actionable. “4.2 GB free” requires the user to do arithmetic about a bitrate they do not know.
- A quiet indicator when frames are being dropped for a sustained period, with the fix rather than the fact: “recording at 4K is dropping frames — 1× would be steady”.
- Nothing at all when everything is fine. A recorder that interrupts a live workshop with a notification has caused a worse problem than the one it was reporting.
We also disable the system idle sleep for the duration, which sounds obvious and was not in our first release. A three-hour recording of a machine that went to sleep after forty minutes of nobody touching the trackpad is a failure mode with no technical interest and a very high cost.
Reproducing all of it without waiting three hours
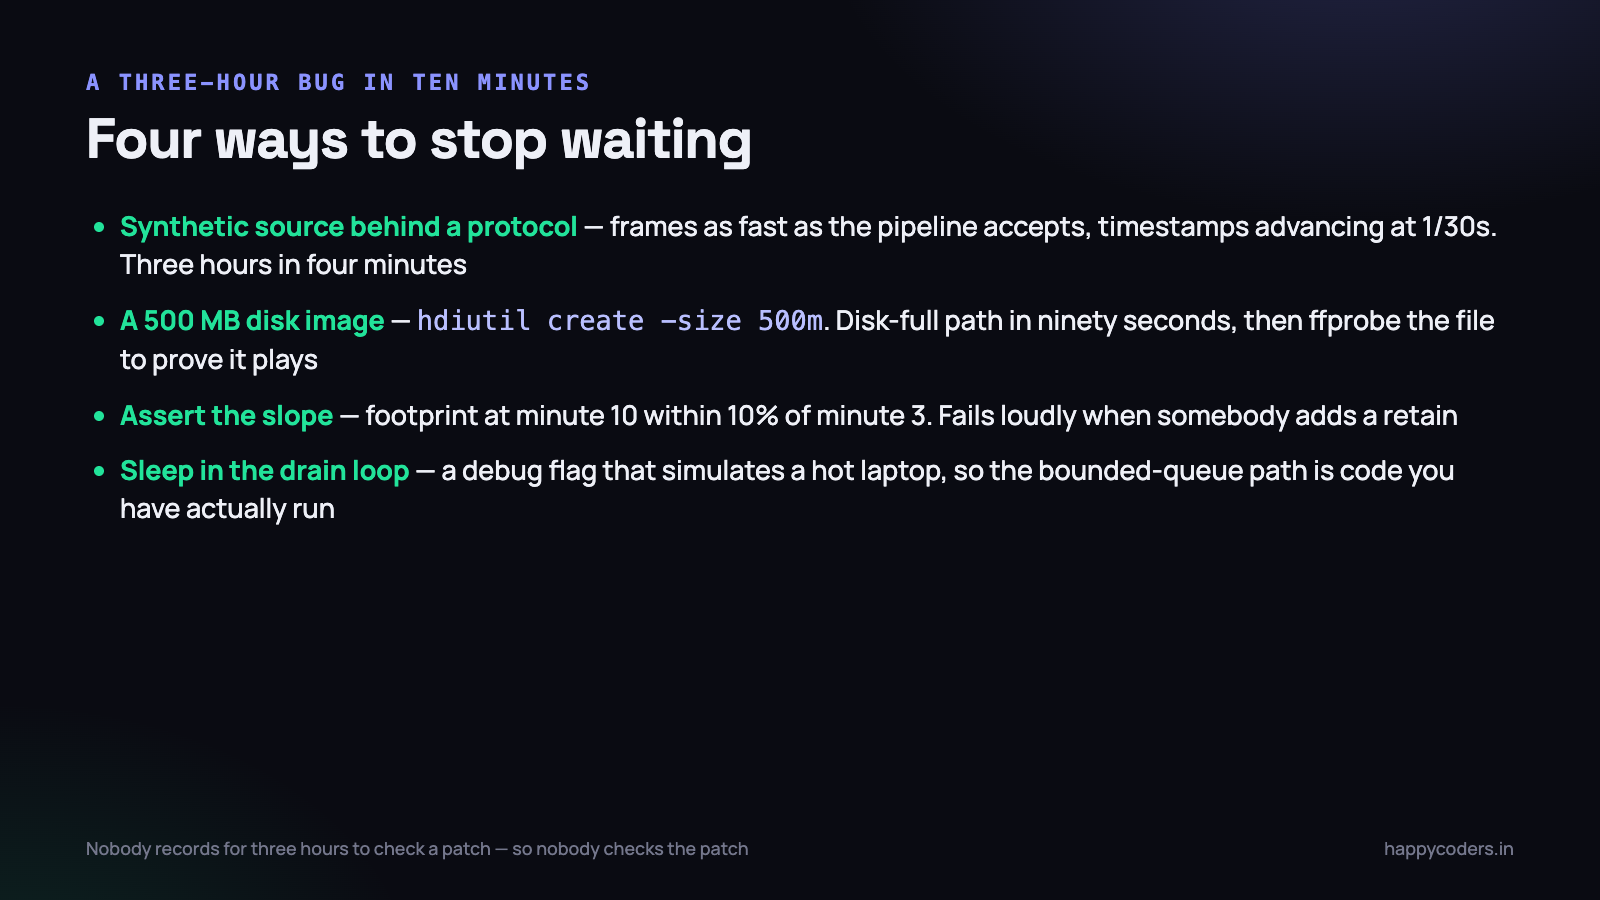
None of the above is testable at the rate a human can work. Nobody is going to record for three hours to check a patch, which means nobody checks the patch, which is how the bug reached a customer in the first place. Four techniques made this tractable for us.
Run the pipeline faster than real time
Separate the capture source from everything downstream behind a protocol, and write a synthetic source that produces frames as fast as the pipeline can accept them, stamping them with timestamps that advance at 1/30 s regardless of wall-clock time. Every stage below capture behaves identically. On a reasonable Mac this replays three hours of frames in about four minutes, and it exercises the leak, the queue and the writer honestly. It is the single highest-value piece of test infrastructure in the project.
Make the disk small instead of making the recording long
You do not need to fill a real SSD to test the disk path. Create a small disk image, point the output at it, and hit the limit in ninety seconds.
hdiutil create -size 500m -fs APFS \
  -volname RecTest /tmp/rectest.dmg
hdiutil attach /tmp/rectest.dmg

# record to /Volumes/RecTest and watch the low-space path run
# ... then check the file actually opens:
ffprobe -v error -show_entries format=duration \
  /Volumes/RecTest/test.mp4
That last line is the assertion that matters. Stopping when the disk is full is easy; stopping with a file that still plays is the behaviour you are actually testing, and it is easy to get wrong in a hurry.
Measure the slope, never the number
For memory, run for ten minutes and fit a line through the footprint samples. A flat line with a sawtooth is healthy. Anything with a positive slope, however small, is a leak that will kill a long recording — and at ten minutes you can see it clearly enough to act on.
We put a hard assertion in the test: over a ten-minute synthetic run, the footprint at minute ten must be within 10% of the footprint at minute three. It fails loudly when somebody introduces a retain, which has happened twice, both times in a preview feature that looked completely harmless.
Force the encoder to fall behind
Thermal throttling is hard to arrange on demand, but the effect is easy to simulate. Add a debug flag that sleeps for a few milliseconds in the encoder drain loop, and the queue fills exactly as it would on a hot laptop. Then check that the drop counter rises, memory stays flat, and the file finishes. Without this, the bounded-queue path is code you have never run.
What to do on Monday morning
If your application produces media, or does anything continuous for hours, this is the order we would do it in again.
- Add a footprint log line every ten seconds. Ten lines of code, and it will tell you more about long-run behaviour than any profiler you attach for five minutes.
- Find every place a capture buffer can escape its callback and close them. Preview features are the usual culprit.
- Put a bound on every queue between capture and disk, and a counter on every bound.
- Check free space before starting and every ten seconds during, using the important-usage key, and stop while there is still room to finalise.
- Build the synthetic source. It turns a three-hour test into a four-minute one, and it is the thing that makes all of the above testable in a normal working day.
The judgement underneath all of it is not really about memory. It is that a long recording is a thing a person cannot repeat, so every failure mode has to end with a file they can still use. A recorder that drops four per cent of frames and finishes has done its job. A recorder that is perfect for two hours and fourteen minutes has not.